Ghanaian vs Bangladeshi Master's Degree
COMPARE
Ghanaian
Bangladeshi
Master's Degree
Master's Degree Comparison
Ghanaians
Bangladeshis
15.5%
MASTER'S DEGREE
78.2/ 100
METRIC RATING
149th/ 347
METRIC RANK
10.5%
MASTER'S DEGREE
0.0/ 100
METRIC RATING
328th/ 347
METRIC RANK
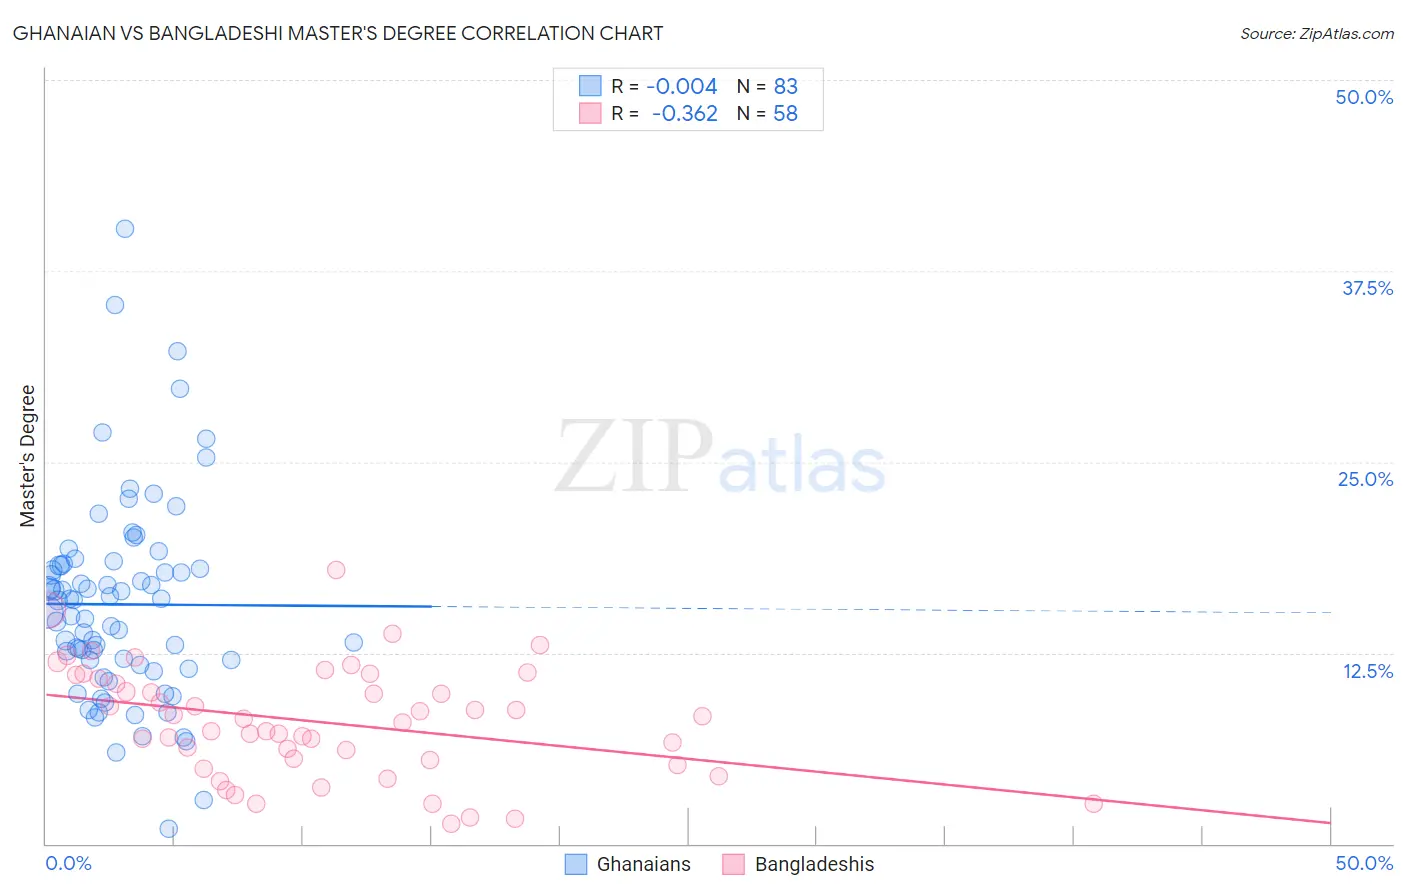
Ghanaian vs Bangladeshi Master's Degree Correlation Chart
The statistical analysis conducted on geographies consisting of 190,610,079 people shows no correlation between the proportion of Ghanaians and percentage of population with at least master's degree education in the United States with a correlation coefficient (R) of -0.004 and weighted average of 15.5%. Similarly, the statistical analysis conducted on geographies consisting of 141,400,977 people shows a mild negative correlation between the proportion of Bangladeshis and percentage of population with at least master's degree education in the United States with a correlation coefficient (R) of -0.362 and weighted average of 10.5%, a difference of 48.2%.
Master's Degree Correlation Summary
| Measurement | Ghanaian | Bangladeshi |
| Minimum | 0.95% | 1.3% |
| Maximum | 40.3% | 17.9% |
| Range | 39.3% | 16.7% |
| Mean | 15.7% | 8.0% |
| Median | 15.9% | 8.1% |
| Interquartile 25% (IQ1) | 11.7% | 5.5% |
| Interquartile 75% (IQ3) | 18.2% | 10.8% |
| Interquartile Range (IQR) | 6.5% | 5.3% |
| Standard Deviation (Sample) | 6.6% | 3.6% |
| Standard Deviation (Population) | 6.6% | 3.6% |
Similar Demographics by Master's Degree
Demographics Similar to Ghanaians by Master's Degree
In terms of master's degree, the demographic groups most similar to Ghanaians are Immigrants from Senegal (15.5%, a difference of 0.010%), Slovene (15.5%, a difference of 0.030%), Iraqi (15.5%, a difference of 0.16%), Hungarian (15.6%, a difference of 0.18%), and Slavic (15.5%, a difference of 0.21%).
| Demographics | Rating | Rank | Master's Degree |
| Immigrants | Africa | 84.0 /100 | #142 | Excellent 15.7% |
| Immigrants | Venezuela | 83.6 /100 | #143 | Excellent 15.7% |
| Canadians | 83.3 /100 | #144 | Excellent 15.7% |
| South Americans | 81.3 /100 | #145 | Excellent 15.6% |
| Immigrants | Afghanistan | 79.4 /100 | #146 | Good 15.6% |
| Hungarians | 79.1 /100 | #147 | Good 15.6% |
| Immigrants | Senegal | 78.2 /100 | #148 | Good 15.5% |
| Ghanaians | 78.2 /100 | #149 | Good 15.5% |
| Slovenes | 78.0 /100 | #150 | Good 15.5% |
| Iraqis | 77.3 /100 | #151 | Good 15.5% |
| Slavs | 77.0 /100 | #152 | Good 15.5% |
| Icelanders | 76.8 /100 | #153 | Good 15.5% |
| Immigrants | South America | 76.3 /100 | #154 | Good 15.5% |
| Immigrants | Bangladesh | 76.1 /100 | #155 | Good 15.5% |
| Bermudans | 73.9 /100 | #156 | Good 15.4% |
Demographics Similar to Bangladeshis by Master's Degree
In terms of master's degree, the demographic groups most similar to Bangladeshis are Nepalese (10.5%, a difference of 0.080%), Paiute (10.5%, a difference of 0.14%), Inupiat (10.5%, a difference of 0.32%), Creek (10.5%, a difference of 0.32%), and Dutch West Indian (10.6%, a difference of 1.4%).
| Demographics | Rating | Rank | Master's Degree |
| Pennsylvania Germans | 0.0 /100 | #321 | Tragic 10.7% |
| Sioux | 0.0 /100 | #322 | Tragic 10.7% |
| Crow | 0.0 /100 | #323 | Tragic 10.6% |
| Dutch West Indians | 0.0 /100 | #324 | Tragic 10.6% |
| Inupiat | 0.0 /100 | #325 | Tragic 10.5% |
| Creek | 0.0 /100 | #326 | Tragic 10.5% |
| Paiute | 0.0 /100 | #327 | Tragic 10.5% |
| Bangladeshis | 0.0 /100 | #328 | Tragic 10.5% |
| Nepalese | 0.0 /100 | #329 | Tragic 10.5% |
| Fijians | 0.0 /100 | #330 | Tragic 10.3% |
| Pueblo | 0.0 /100 | #331 | Tragic 10.3% |
| Immigrants | Azores | 0.0 /100 | #332 | Tragic 10.2% |
| Menominee | 0.0 /100 | #333 | Tragic 10.2% |
| Arapaho | 0.0 /100 | #334 | Tragic 10.0% |
| Immigrants | Central America | 0.0 /100 | #335 | Tragic 10.0% |