French vs Paiute 4th Grade
COMPARE
French
Paiute
4th Grade
4th Grade Comparison
French
Paiute
98.3%
4TH GRADE
100.0/ 100
METRIC RATING
28th/ 347
METRIC RANK
97.3%
4TH GRADE
13.2/ 100
METRIC RATING
205th/ 347
METRIC RANK
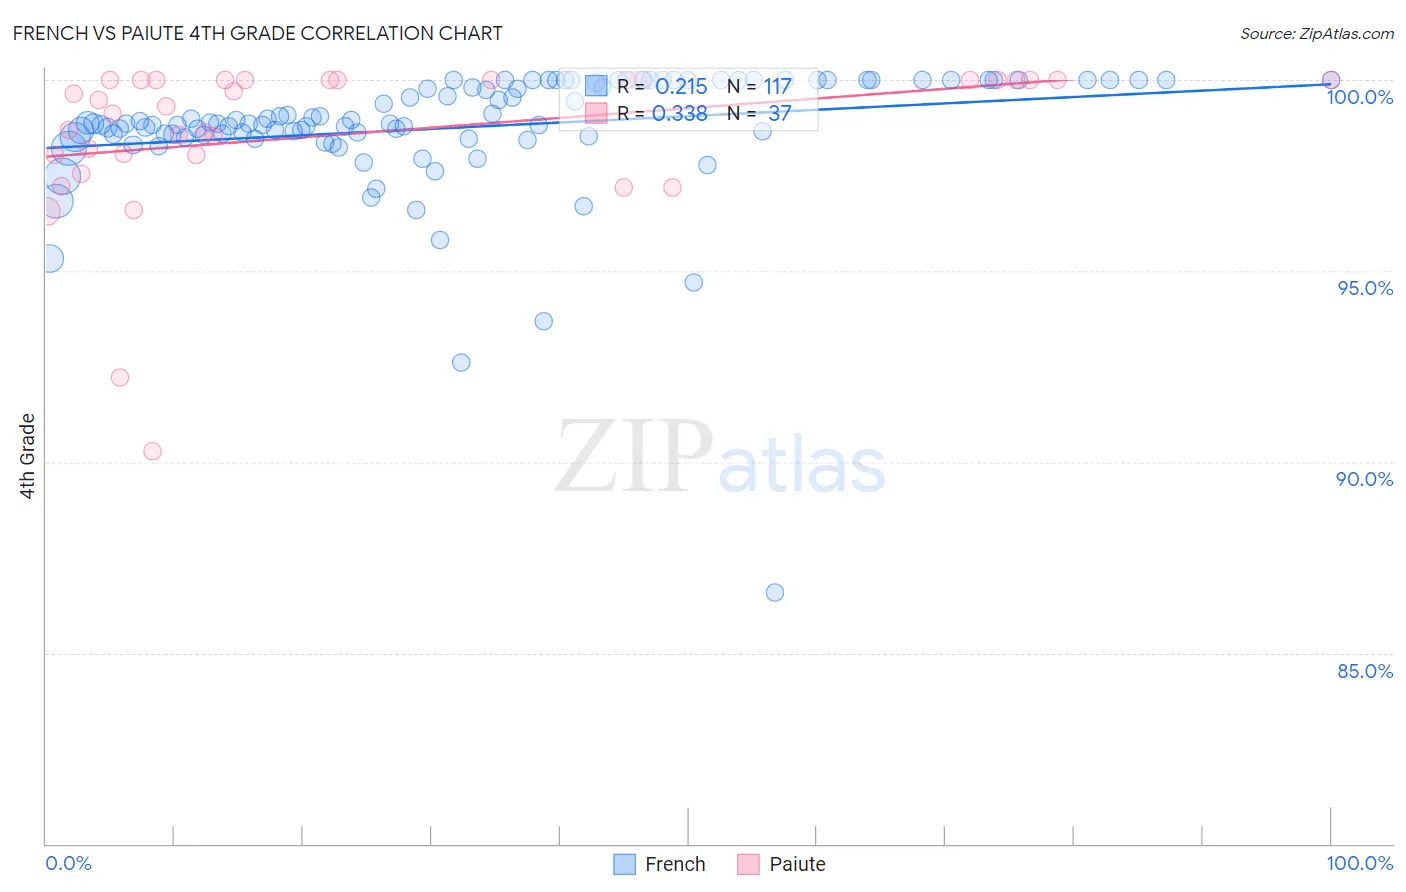
French vs Paiute 4th Grade Correlation Chart
The statistical analysis conducted on geographies consisting of 572,427,269 people shows a weak positive correlation between the proportion of French and percentage of population with at least 4th grade education in the United States with a correlation coefficient (R) of 0.215 and weighted average of 98.3%. Similarly, the statistical analysis conducted on geographies consisting of 58,402,332 people shows a mild positive correlation between the proportion of Paiute and percentage of population with at least 4th grade education in the United States with a correlation coefficient (R) of 0.338 and weighted average of 97.3%, a difference of 0.98%.
4th Grade Correlation Summary
| Measurement | French | Paiute |
| Minimum | 86.6% | 90.3% |
| Maximum | 100.0% | 100.0% |
| Range | 13.4% | 9.7% |
| Mean | 98.8% | 98.6% |
| Median | 98.9% | 99.5% |
| Interquartile 25% (IQ1) | 98.5% | 98.0% |
| Interquartile 75% (IQ3) | 100.0% | 100.0% |
| Interquartile Range (IQR) | 1.5% | 2.0% |
| Standard Deviation (Sample) | 1.7% | 2.1% |
| Standard Deviation (Population) | 1.7% | 2.1% |
Similar Demographics by 4th Grade
Demographics Similar to French by 4th Grade
In terms of 4th grade, the demographic groups most similar to French are French Canadian (98.3%, a difference of 0.0%), Croatian (98.3%, a difference of 0.010%), Czech (98.3%, a difference of 0.010%), Danish (98.3%, a difference of 0.020%), and Scotch-Irish (98.3%, a difference of 0.020%).
| Demographics | Rating | Rank | 4th Grade |
| Lithuanians | 100.0 /100 | #21 | Exceptional 98.3% |
| Finns | 100.0 /100 | #22 | Exceptional 98.3% |
| Sioux | 100.0 /100 | #23 | Exceptional 98.3% |
| Danes | 100.0 /100 | #24 | Exceptional 98.3% |
| Scotch-Irish | 100.0 /100 | #25 | Exceptional 98.3% |
| Croatians | 100.0 /100 | #26 | Exceptional 98.3% |
| French Canadians | 100.0 /100 | #27 | Exceptional 98.3% |
| French | 100.0 /100 | #28 | Exceptional 98.3% |
| Czechs | 100.0 /100 | #29 | Exceptional 98.3% |
| Scandinavians | 100.0 /100 | #30 | Exceptional 98.3% |
| Europeans | 100.0 /100 | #31 | Exceptional 98.3% |
| Chinese | 100.0 /100 | #32 | Exceptional 98.3% |
| Swiss | 100.0 /100 | #33 | Exceptional 98.2% |
| Chippewa | 100.0 /100 | #34 | Exceptional 98.2% |
| Italians | 100.0 /100 | #35 | Exceptional 98.2% |
Demographics Similar to Paiute by 4th Grade
In terms of 4th grade, the demographic groups most similar to Paiute are Immigrants from Zaire (97.3%, a difference of 0.0%), Immigrants from Northern Africa (97.4%, a difference of 0.010%), African (97.4%, a difference of 0.010%), Immigrants from Southern Europe (97.4%, a difference of 0.020%), and Immigrants from Chile (97.4%, a difference of 0.020%).
| Demographics | Rating | Rank | 4th Grade |
| Guamanians/Chamorros | 23.0 /100 | #198 | Fair 97.4% |
| Natives/Alaskans | 20.6 /100 | #199 | Fair 97.4% |
| Immigrants | Uganda | 19.8 /100 | #200 | Poor 97.4% |
| Immigrants | Southern Europe | 16.2 /100 | #201 | Poor 97.4% |
| Immigrants | Chile | 16.1 /100 | #202 | Poor 97.4% |
| Immigrants | Northern Africa | 15.1 /100 | #203 | Poor 97.4% |
| Africans | 14.6 /100 | #204 | Poor 97.4% |
| Paiute | 13.2 /100 | #205 | Poor 97.3% |
| Immigrants | Zaire | 12.8 /100 | #206 | Poor 97.3% |
| Moroccans | 11.3 /100 | #207 | Poor 97.3% |
| Immigrants | Bahamas | 10.8 /100 | #208 | Poor 97.3% |
| Laotians | 9.3 /100 | #209 | Tragic 97.3% |
| Immigrants | Oceania | 9.1 /100 | #210 | Tragic 97.3% |
| Sudanese | 9.0 /100 | #211 | Tragic 97.3% |
| Tohono O'odham | 8.4 /100 | #212 | Tragic 97.3% |