Carpatho Rusyn vs Sudanese 7th Grade
COMPARE
Carpatho Rusyn
Sudanese
7th Grade
7th Grade Comparison
Carpatho Rusyns
Sudanese
98.3%
7TH GRADE
100.0/ 100
METRIC RATING
3rd/ 347
METRIC RANK
95.9%
7TH GRADE
28.1/ 100
METRIC RATING
195th/ 347
METRIC RANK
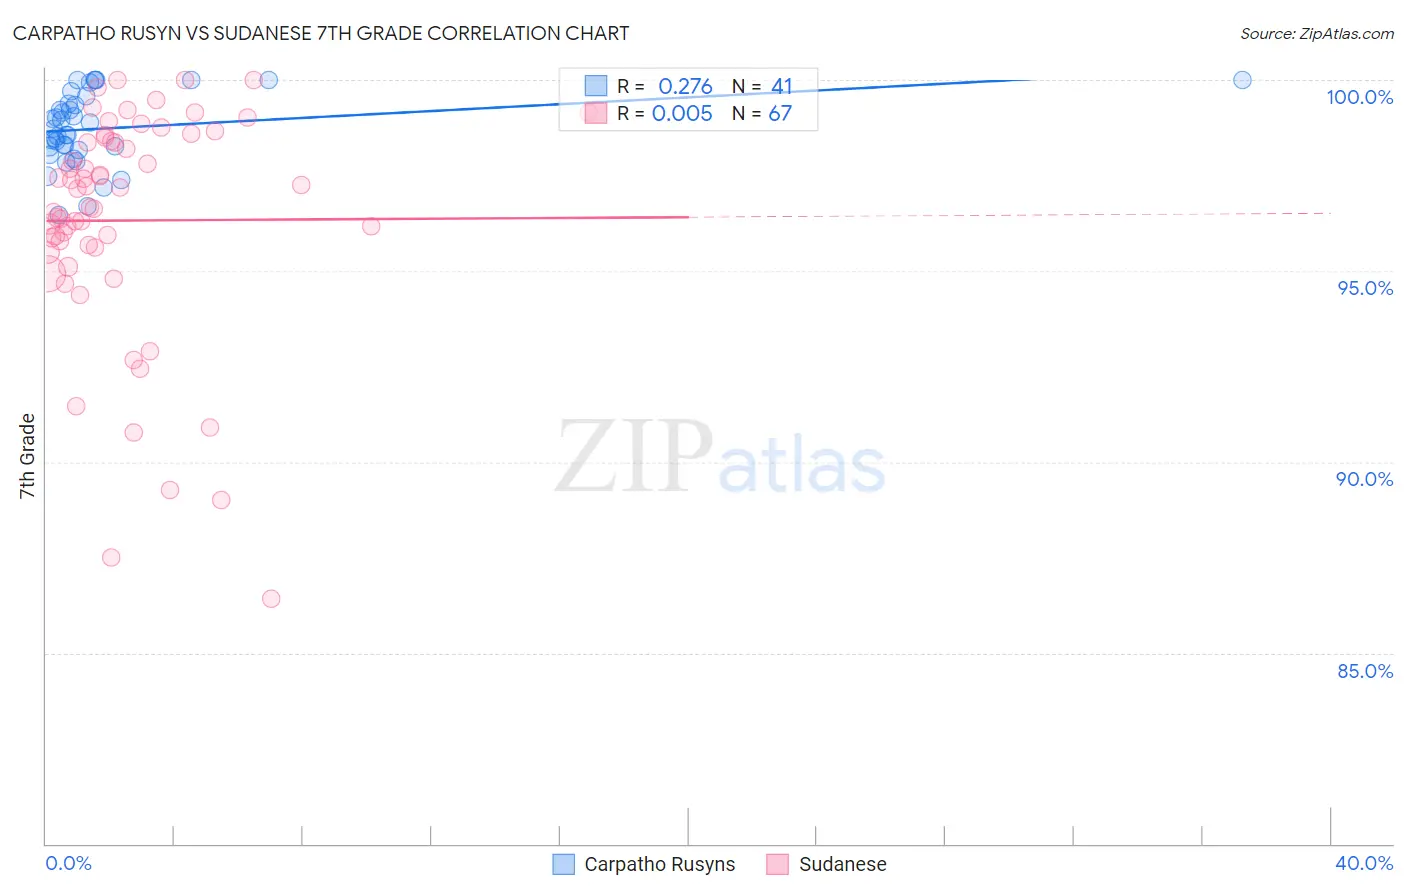
Carpatho Rusyn vs Sudanese 7th Grade Correlation Chart
The statistical analysis conducted on geographies consisting of 10,071,463 people shows a weak positive correlation between the proportion of Carpatho Rusyns and percentage of population with at least 7th grade education in the United States with a correlation coefficient (R) of 0.276 and weighted average of 98.3%. Similarly, the statistical analysis conducted on geographies consisting of 110,134,719 people shows no correlation between the proportion of Sudanese and percentage of population with at least 7th grade education in the United States with a correlation coefficient (R) of 0.005 and weighted average of 95.9%, a difference of 2.5%.
7th Grade Correlation Summary
| Measurement | Carpatho Rusyn | Sudanese |
| Minimum | 96.5% | 86.4% |
| Maximum | 100.0% | 100.0% |
| Range | 3.5% | 13.6% |
| Mean | 98.7% | 96.3% |
| Median | 98.7% | 97.2% |
| Interquartile 25% (IQ1) | 98.2% | 95.6% |
| Interquartile 75% (IQ3) | 99.5% | 98.5% |
| Interquartile Range (IQR) | 1.3% | 2.9% |
| Standard Deviation (Sample) | 0.94% | 3.0% |
| Standard Deviation (Population) | 0.93% | 3.0% |
Similar Demographics by 7th Grade
Demographics Similar to Carpatho Rusyns by 7th Grade
In terms of 7th grade, the demographic groups most similar to Carpatho Rusyns are Finnish (98.5%, a difference of 0.18%), Ottawa (98.1%, a difference of 0.20%), Dutch (97.9%, a difference of 0.46%), Tsimshian (97.8%, a difference of 0.53%), and Norwegian (97.8%, a difference of 0.56%).
| Demographics | Rating | Rank | 7th Grade |
| Crow | 100.0 /100 | #1 | Exceptional 99.1% |
| Finns | 100.0 /100 | #2 | Exceptional 98.5% |
| Carpatho Rusyns | 100.0 /100 | #3 | Exceptional 98.3% |
| Ottawa | 100.0 /100 | #4 | Exceptional 98.1% |
| Dutch | 100.0 /100 | #5 | Exceptional 97.9% |
| Tsimshian | 100.0 /100 | #6 | Exceptional 97.8% |
| Norwegians | 100.0 /100 | #7 | Exceptional 97.8% |
| Slovaks | 100.0 /100 | #8 | Exceptional 97.8% |
| Germans | 100.0 /100 | #9 | Exceptional 97.7% |
| Slovenes | 100.0 /100 | #10 | Exceptional 97.6% |
| Alaskan Athabascans | 100.0 /100 | #11 | Exceptional 97.6% |
| Poles | 100.0 /100 | #12 | Exceptional 97.6% |
| Swedes | 100.0 /100 | #13 | Exceptional 97.6% |
| Pennsylvania Germans | 100.0 /100 | #14 | Exceptional 97.6% |
| English | 100.0 /100 | #15 | Exceptional 97.6% |
Demographics Similar to Sudanese by 7th Grade
In terms of 7th grade, the demographic groups most similar to Sudanese are Apache (95.9%, a difference of 0.0%), Immigrants from Nepal (95.9%, a difference of 0.010%), Immigrants from Zaire (95.9%, a difference of 0.010%), Immigrants from Bahamas (95.9%, a difference of 0.020%), and Immigrants from Micronesia (95.9%, a difference of 0.030%).
| Demographics | Rating | Rank | 7th Grade |
| Immigrants | Egypt | 34.3 /100 | #188 | Fair 95.9% |
| Immigrants | Venezuela | 33.9 /100 | #189 | Fair 95.9% |
| Immigrants | Micronesia | 32.6 /100 | #190 | Fair 95.9% |
| Liberians | 32.5 /100 | #191 | Fair 95.9% |
| Panamanians | 32.3 /100 | #192 | Fair 95.9% |
| Immigrants | Bahamas | 30.8 /100 | #193 | Fair 95.9% |
| Immigrants | Nepal | 30.0 /100 | #194 | Fair 95.9% |
| Sudanese | 28.1 /100 | #195 | Fair 95.9% |
| Apache | 27.6 /100 | #196 | Fair 95.9% |
| Immigrants | Zaire | 26.7 /100 | #197 | Fair 95.9% |
| Paraguayans | 24.8 /100 | #198 | Fair 95.9% |
| Guamanians/Chamorros | 23.5 /100 | #199 | Fair 95.9% |
| Argentineans | 23.2 /100 | #200 | Fair 95.9% |
| Immigrants | Argentina | 21.9 /100 | #201 | Fair 95.9% |
| Immigrants | Northern Africa | 21.4 /100 | #202 | Fair 95.8% |