Russian vs Lebanese No Schooling Completed
COMPARE
Russian
Lebanese
No Schooling Completed
No Schooling Completed Comparison
Russians
Lebanese
1.7%
NO SCHOOLING COMPLETED
99.8/ 100
METRIC RATING
63rd/ 347
METRIC RANK
1.9%
NO SCHOOLING COMPLETED
96.0/ 100
METRIC RATING
116th/ 347
METRIC RANK
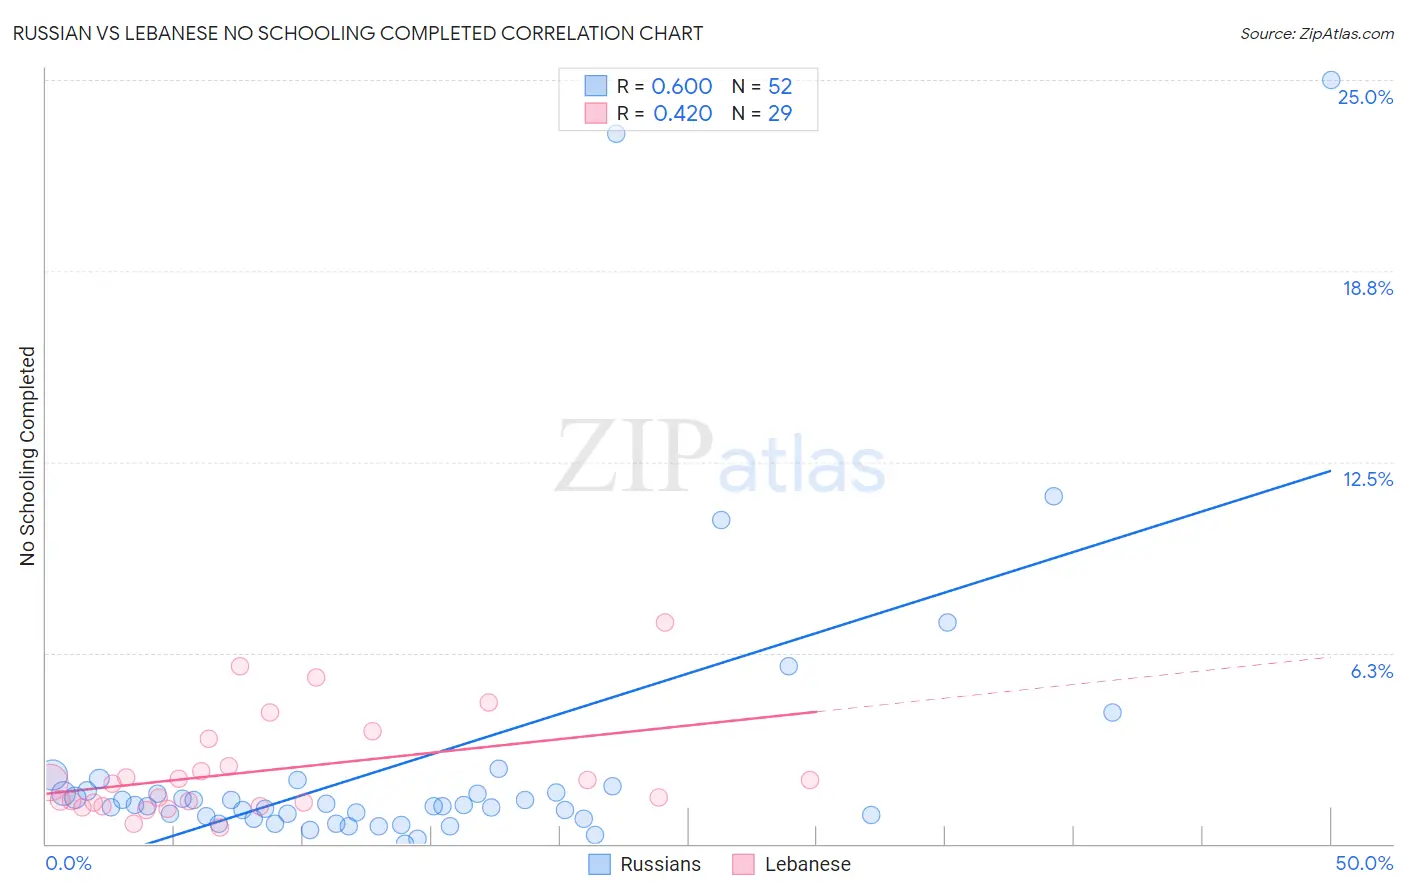
Russian vs Lebanese No Schooling Completed Correlation Chart
The statistical analysis conducted on geographies consisting of 500,481,409 people shows a significant positive correlation between the proportion of Russians and percentage of population with no schooling in the United States with a correlation coefficient (R) of 0.600 and weighted average of 1.7%. Similarly, the statistical analysis conducted on geographies consisting of 396,753,431 people shows a moderate positive correlation between the proportion of Lebanese and percentage of population with no schooling in the United States with a correlation coefficient (R) of 0.420 and weighted average of 1.9%, a difference of 12.0%.
No Schooling Completed Correlation Summary
| Measurement | Russian | Lebanese |
| Minimum | 0.017% | 0.52% |
| Maximum | 25.0% | 7.2% |
| Range | 25.0% | 6.7% |
| Mean | 2.7% | 2.4% |
| Median | 1.3% | 2.0% |
| Interquartile 25% (IQ1) | 0.87% | 1.3% |
| Interquartile 75% (IQ3) | 1.7% | 3.0% |
| Interquartile Range (IQR) | 0.83% | 1.7% |
| Standard Deviation (Sample) | 4.9% | 1.7% |
| Standard Deviation (Population) | 4.8% | 1.6% |
Similar Demographics by No Schooling Completed
Demographics Similar to Russians by No Schooling Completed
In terms of no schooling completed, the demographic groups most similar to Russians are Immigrants from Northern Europe (1.7%, a difference of 0.040%), New Zealander (1.7%, a difference of 0.16%), Serbian (1.7%, a difference of 0.20%), Canadian (1.7%, a difference of 0.34%), and Immigrants from Austria (1.7%, a difference of 0.53%).
| Demographics | Rating | Rank | No Schooling Completed |
| Immigrants | North America | 99.8 /100 | #56 | Exceptional 1.6% |
| Austrians | 99.8 /100 | #57 | Exceptional 1.6% |
| Kiowa | 99.8 /100 | #58 | Exceptional 1.6% |
| Slavs | 99.8 /100 | #59 | Exceptional 1.7% |
| Americans | 99.8 /100 | #60 | Exceptional 1.7% |
| Tsimshian | 99.8 /100 | #61 | Exceptional 1.7% |
| Immigrants | Northern Europe | 99.8 /100 | #62 | Exceptional 1.7% |
| Russians | 99.8 /100 | #63 | Exceptional 1.7% |
| New Zealanders | 99.7 /100 | #64 | Exceptional 1.7% |
| Serbians | 99.7 /100 | #65 | Exceptional 1.7% |
| Canadians | 99.7 /100 | #66 | Exceptional 1.7% |
| Immigrants | Austria | 99.7 /100 | #67 | Exceptional 1.7% |
| Immigrants | Lithuania | 99.7 /100 | #68 | Exceptional 1.7% |
| Chickasaw | 99.6 /100 | #69 | Exceptional 1.7% |
| Immigrants | Netherlands | 99.6 /100 | #70 | Exceptional 1.7% |
Demographics Similar to Lebanese by No Schooling Completed
In terms of no schooling completed, the demographic groups most similar to Lebanese are Syrian (1.9%, a difference of 0.020%), Immigrants from Norway (1.9%, a difference of 0.15%), Immigrants from Zimbabwe (1.9%, a difference of 0.16%), Immigrants from Serbia (1.9%, a difference of 0.20%), and Pueblo (1.9%, a difference of 0.41%).
| Demographics | Rating | Rank | No Schooling Completed |
| Immigrants | Saudi Arabia | 96.8 /100 | #109 | Exceptional 1.9% |
| Immigrants | Latvia | 96.7 /100 | #110 | Exceptional 1.9% |
| Immigrants | Japan | 96.6 /100 | #111 | Exceptional 1.9% |
| Pueblo | 96.4 /100 | #112 | Exceptional 1.9% |
| Immigrants | Zimbabwe | 96.2 /100 | #113 | Exceptional 1.9% |
| Immigrants | Norway | 96.1 /100 | #114 | Exceptional 1.9% |
| Syrians | 96.0 /100 | #115 | Exceptional 1.9% |
| Lebanese | 96.0 /100 | #116 | Exceptional 1.9% |
| Immigrants | Serbia | 95.8 /100 | #117 | Exceptional 1.9% |
| Spanish | 95.5 /100 | #118 | Exceptional 1.9% |
| Iroquois | 95.1 /100 | #119 | Exceptional 1.9% |
| Immigrants | Bulgaria | 94.6 /100 | #120 | Exceptional 1.9% |
| Immigrants | Croatia | 94.5 /100 | #121 | Exceptional 1.9% |
| Cree | 94.5 /100 | #122 | Exceptional 1.9% |
| Immigrants | Kuwait | 93.9 /100 | #123 | Exceptional 1.9% |