French Canadian vs Immigrants from South Eastern Asia 10th Grade
COMPARE
French Canadian
Immigrants from South Eastern Asia
10th Grade
10th Grade Comparison
French Canadians
Immigrants from South Eastern Asia
95.3%
10TH GRADE
99.9/ 100
METRIC RATING
37th/ 347
METRIC RANK
92.1%
10TH GRADE
0.0/ 100
METRIC RATING
285th/ 347
METRIC RANK
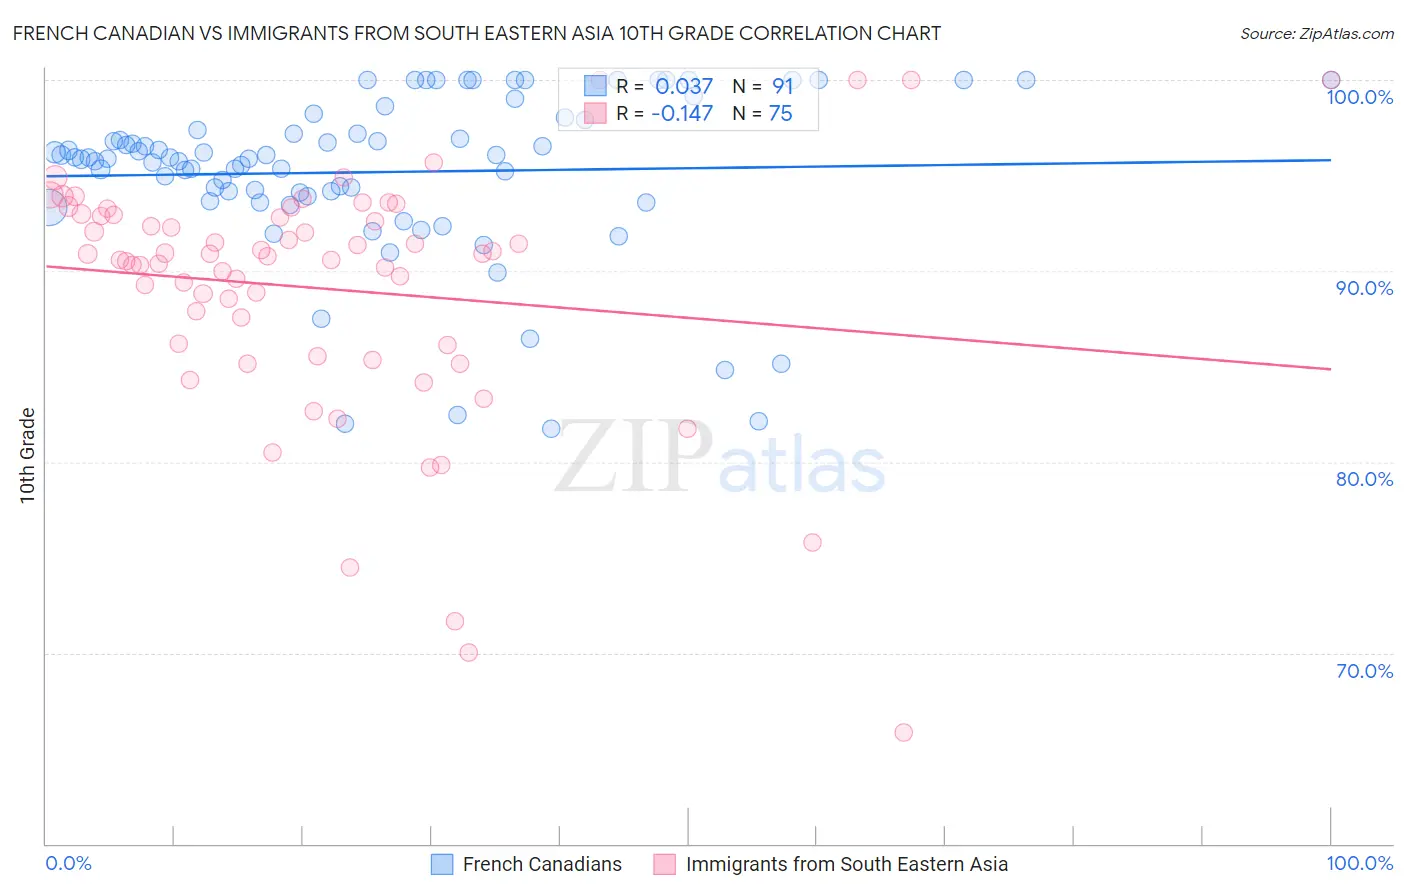
French Canadian vs Immigrants from South Eastern Asia 10th Grade Correlation Chart
The statistical analysis conducted on geographies consisting of 502,679,499 people shows no correlation between the proportion of French Canadians and percentage of population with at least 10th grade education in the United States with a correlation coefficient (R) of 0.037 and weighted average of 95.3%. Similarly, the statistical analysis conducted on geographies consisting of 512,709,822 people shows a poor negative correlation between the proportion of Immigrants from South Eastern Asia and percentage of population with at least 10th grade education in the United States with a correlation coefficient (R) of -0.147 and weighted average of 92.1%, a difference of 3.5%.
10th Grade Correlation Summary
| Measurement | French Canadian | Immigrants from South Eastern Asia |
| Minimum | 81.7% | 65.9% |
| Maximum | 100.0% | 100.0% |
| Range | 18.3% | 34.1% |
| Mean | 95.2% | 89.1% |
| Median | 95.9% | 90.8% |
| Interquartile 25% (IQ1) | 93.9% | 86.1% |
| Interquartile 75% (IQ3) | 97.9% | 92.9% |
| Interquartile Range (IQR) | 4.0% | 6.8% |
| Standard Deviation (Sample) | 4.3% | 6.5% |
| Standard Deviation (Population) | 4.3% | 6.4% |
Similar Demographics by 10th Grade
Demographics Similar to French Canadians by 10th Grade
In terms of 10th grade, the demographic groups most similar to French Canadians are Estonian (95.3%, a difference of 0.020%), Immigrants from India (95.3%, a difference of 0.020%), British (95.3%, a difference of 0.030%), Northern European (95.3%, a difference of 0.030%), and Iranian (95.3%, a difference of 0.040%).
| Demographics | Rating | Rank | 10th Grade |
| Belgians | 100.0 /100 | #30 | Exceptional 95.4% |
| Iranians | 100.0 /100 | #31 | Exceptional 95.3% |
| Hungarians | 100.0 /100 | #32 | Exceptional 95.3% |
| French | 100.0 /100 | #33 | Exceptional 95.3% |
| British | 99.9 /100 | #34 | Exceptional 95.3% |
| Estonians | 99.9 /100 | #35 | Exceptional 95.3% |
| Immigrants | India | 99.9 /100 | #36 | Exceptional 95.3% |
| French Canadians | 99.9 /100 | #37 | Exceptional 95.3% |
| Northern Europeans | 99.9 /100 | #38 | Exceptional 95.3% |
| Immigrants | Scotland | 99.9 /100 | #39 | Exceptional 95.2% |
| Scotch-Irish | 99.9 /100 | #40 | Exceptional 95.2% |
| Russians | 99.9 /100 | #41 | Exceptional 95.2% |
| Slavs | 99.9 /100 | #42 | Exceptional 95.2% |
| Macedonians | 99.9 /100 | #43 | Exceptional 95.2% |
| Immigrants | Northern Europe | 99.9 /100 | #44 | Exceptional 95.2% |
Demographics Similar to Immigrants from South Eastern Asia by 10th Grade
In terms of 10th grade, the demographic groups most similar to Immigrants from South Eastern Asia are Immigrants from Barbados (92.1%, a difference of 0.020%), Immigrants from St. Vincent and the Grenadines (92.1%, a difference of 0.030%), Yuman (92.0%, a difference of 0.050%), Immigrants from Peru (92.2%, a difference of 0.10%), and Bangladeshi (92.2%, a difference of 0.12%).
| Demographics | Rating | Rank | 10th Grade |
| Barbadians | 0.1 /100 | #278 | Tragic 92.2% |
| Natives/Alaskans | 0.1 /100 | #279 | Tragic 92.2% |
| Malaysians | 0.1 /100 | #280 | Tragic 92.2% |
| Bangladeshis | 0.1 /100 | #281 | Tragic 92.2% |
| Immigrants | Peru | 0.1 /100 | #282 | Tragic 92.2% |
| Immigrants | St. Vincent and the Grenadines | 0.0 /100 | #283 | Tragic 92.1% |
| Immigrants | Barbados | 0.0 /100 | #284 | Tragic 92.1% |
| Immigrants | South Eastern Asia | 0.0 /100 | #285 | Tragic 92.1% |
| Yuman | 0.0 /100 | #286 | Tragic 92.0% |
| Pennsylvania Germans | 0.0 /100 | #287 | Tragic 91.9% |
| Immigrants | Laos | 0.0 /100 | #288 | Tragic 91.9% |
| Sri Lankans | 0.0 /100 | #289 | Tragic 91.8% |
| British West Indians | 0.0 /100 | #290 | Tragic 91.8% |
| Immigrants | West Indies | 0.0 /100 | #291 | Tragic 91.8% |
| Immigrants | Burma/Myanmar | 0.0 /100 | #292 | Tragic 91.8% |