French Canadian vs Colville 10th Grade
COMPARE
French Canadian
Colville
10th Grade
10th Grade Comparison
French Canadians
Colville
95.3%
10TH GRADE
99.9/ 100
METRIC RATING
37th/ 347
METRIC RANK
93.6%
10TH GRADE
38.8/ 100
METRIC RATING
182nd/ 347
METRIC RANK
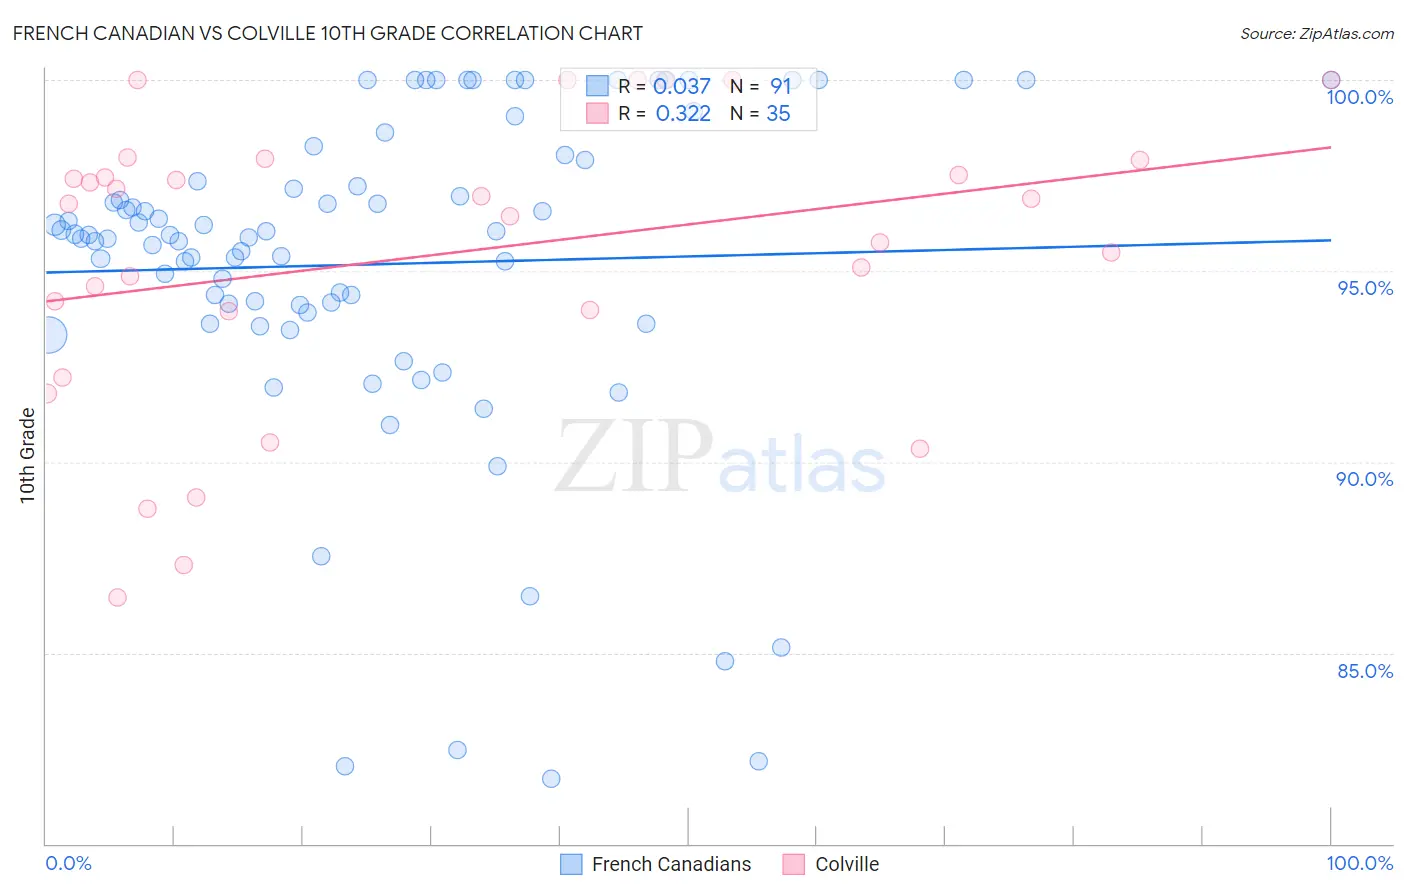
French Canadian vs Colville 10th Grade Correlation Chart
The statistical analysis conducted on geographies consisting of 502,679,499 people shows no correlation between the proportion of French Canadians and percentage of population with at least 10th grade education in the United States with a correlation coefficient (R) of 0.037 and weighted average of 95.3%. Similarly, the statistical analysis conducted on geographies consisting of 34,682,094 people shows a mild positive correlation between the proportion of Colville and percentage of population with at least 10th grade education in the United States with a correlation coefficient (R) of 0.322 and weighted average of 93.6%, a difference of 1.8%.
10th Grade Correlation Summary
| Measurement | French Canadian | Colville |
| Minimum | 81.7% | 86.4% |
| Maximum | 100.0% | 100.0% |
| Range | 18.3% | 13.6% |
| Mean | 95.2% | 95.4% |
| Median | 95.9% | 96.8% |
| Interquartile 25% (IQ1) | 93.9% | 93.9% |
| Interquartile 75% (IQ3) | 97.9% | 97.9% |
| Interquartile Range (IQR) | 4.0% | 4.0% |
| Standard Deviation (Sample) | 4.3% | 3.8% |
| Standard Deviation (Population) | 4.3% | 3.7% |
Similar Demographics by 10th Grade
Demographics Similar to French Canadians by 10th Grade
In terms of 10th grade, the demographic groups most similar to French Canadians are Estonian (95.3%, a difference of 0.020%), Immigrants from India (95.3%, a difference of 0.020%), British (95.3%, a difference of 0.030%), Northern European (95.3%, a difference of 0.030%), and Iranian (95.3%, a difference of 0.040%).
| Demographics | Rating | Rank | 10th Grade |
| Belgians | 100.0 /100 | #30 | Exceptional 95.4% |
| Iranians | 100.0 /100 | #31 | Exceptional 95.3% |
| Hungarians | 100.0 /100 | #32 | Exceptional 95.3% |
| French | 100.0 /100 | #33 | Exceptional 95.3% |
| British | 99.9 /100 | #34 | Exceptional 95.3% |
| Estonians | 99.9 /100 | #35 | Exceptional 95.3% |
| Immigrants | India | 99.9 /100 | #36 | Exceptional 95.3% |
| French Canadians | 99.9 /100 | #37 | Exceptional 95.3% |
| Northern Europeans | 99.9 /100 | #38 | Exceptional 95.3% |
| Immigrants | Scotland | 99.9 /100 | #39 | Exceptional 95.2% |
| Scotch-Irish | 99.9 /100 | #40 | Exceptional 95.2% |
| Russians | 99.9 /100 | #41 | Exceptional 95.2% |
| Slavs | 99.9 /100 | #42 | Exceptional 95.2% |
| Macedonians | 99.9 /100 | #43 | Exceptional 95.2% |
| Immigrants | Northern Europe | 99.9 /100 | #44 | Exceptional 95.2% |
Demographics Similar to Colville by 10th Grade
In terms of 10th grade, the demographic groups most similar to Colville are Guamanian/Chamorro (93.6%, a difference of 0.020%), Choctaw (93.6%, a difference of 0.020%), Sudanese (93.6%, a difference of 0.020%), Immigrants from Northern Africa (93.7%, a difference of 0.030%), and Blackfeet (93.7%, a difference of 0.040%).
| Demographics | Rating | Rank | 10th Grade |
| Immigrants | Nepal | 49.6 /100 | #175 | Average 93.7% |
| Immigrants | Argentina | 47.1 /100 | #176 | Average 93.7% |
| Immigrants | Lebanon | 47.1 /100 | #177 | Average 93.7% |
| Sierra Leoneans | 46.1 /100 | #178 | Average 93.7% |
| Paraguayans | 45.3 /100 | #179 | Average 93.7% |
| Blackfeet | 42.8 /100 | #180 | Average 93.7% |
| Immigrants | Northern Africa | 41.6 /100 | #181 | Average 93.7% |
| Colville | 38.8 /100 | #182 | Fair 93.6% |
| Guamanians/Chamorros | 37.1 /100 | #183 | Fair 93.6% |
| Choctaw | 36.6 /100 | #184 | Fair 93.6% |
| Sudanese | 36.6 /100 | #185 | Fair 93.6% |
| Immigrants | Eastern Asia | 35.1 /100 | #186 | Fair 93.6% |
| Liberians | 34.7 /100 | #187 | Fair 93.6% |
| Marshallese | 33.2 /100 | #188 | Fair 93.6% |
| Immigrants | Pakistan | 32.5 /100 | #189 | Fair 93.6% |