Celtic vs Immigrants from Canada 11th Grade
COMPARE
Celtic
Immigrants from Canada
11th Grade
11th Grade Comparison
Celtics
Immigrants from Canada
93.7%
11TH GRADE
99.5/ 100
METRIC RATING
76th/ 347
METRIC RANK
94.0%
11TH GRADE
99.9/ 100
METRIC RATING
52nd/ 347
METRIC RANK
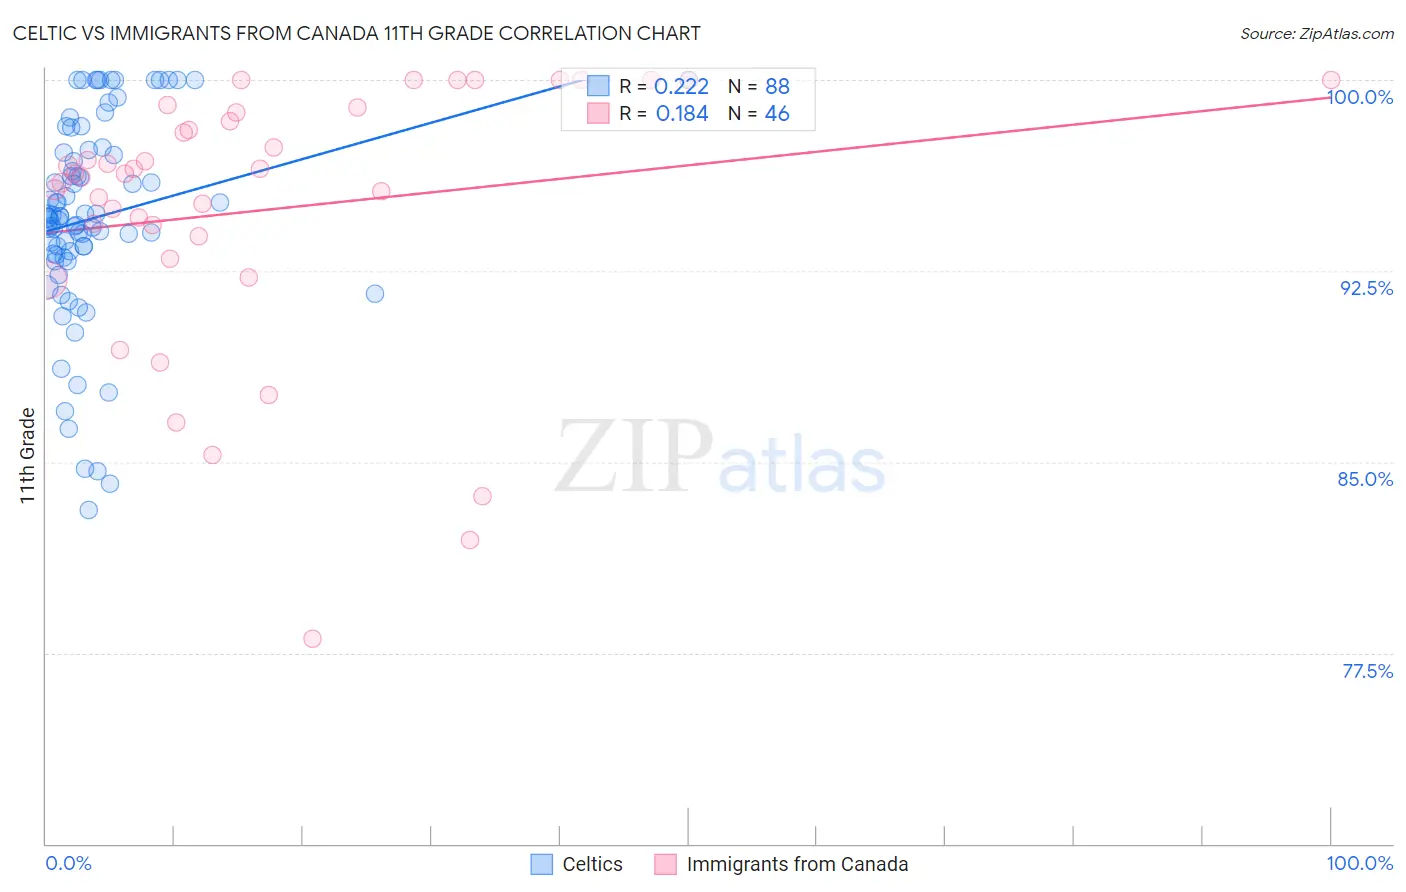
Celtic vs Immigrants from Canada 11th Grade Correlation Chart
The statistical analysis conducted on geographies consisting of 168,876,981 people shows a weak positive correlation between the proportion of Celtics and percentage of population with at least 11th grade education in the United States with a correlation coefficient (R) of 0.222 and weighted average of 93.7%. Similarly, the statistical analysis conducted on geographies consisting of 459,397,067 people shows a poor positive correlation between the proportion of Immigrants from Canada and percentage of population with at least 11th grade education in the United States with a correlation coefficient (R) of 0.184 and weighted average of 94.0%, a difference of 0.30%.
11th Grade Correlation Summary
| Measurement | Celtic | Immigrants from Canada |
| Minimum | 83.1% | 78.1% |
| Maximum | 100.0% | 100.0% |
| Range | 16.9% | 21.9% |
| Mean | 94.6% | 94.9% |
| Median | 94.6% | 96.3% |
| Interquartile 25% (IQ1) | 93.2% | 93.9% |
| Interquartile 75% (IQ3) | 97.2% | 98.7% |
| Interquartile Range (IQR) | 4.0% | 4.9% |
| Standard Deviation (Sample) | 4.0% | 5.2% |
| Standard Deviation (Population) | 3.9% | 5.2% |
Similar Demographics by 11th Grade
Demographics Similar to Celtics by 11th Grade
In terms of 11th grade, the demographic groups most similar to Celtics are Aleut (93.7%, a difference of 0.0%), Soviet Union (93.7%, a difference of 0.010%), Immigrants from Denmark (93.7%, a difference of 0.010%), Immigrants from Latvia (93.8%, a difference of 0.030%), and Canadian (93.7%, a difference of 0.030%).
| Demographics | Rating | Rank | 11th Grade |
| Scotch-Irish | 99.8 /100 | #69 | Exceptional 93.9% |
| Immigrants | England | 99.7 /100 | #70 | Exceptional 93.8% |
| Immigrants | South Africa | 99.7 /100 | #71 | Exceptional 93.8% |
| Immigrants | Japan | 99.7 /100 | #72 | Exceptional 93.8% |
| Romanians | 99.6 /100 | #73 | Exceptional 93.8% |
| Immigrants | Czechoslovakia | 99.6 /100 | #74 | Exceptional 93.8% |
| Immigrants | Latvia | 99.6 /100 | #75 | Exceptional 93.8% |
| Celtics | 99.5 /100 | #76 | Exceptional 93.7% |
| Aleuts | 99.5 /100 | #77 | Exceptional 93.7% |
| Soviet Union | 99.5 /100 | #78 | Exceptional 93.7% |
| Immigrants | Denmark | 99.5 /100 | #79 | Exceptional 93.7% |
| Canadians | 99.5 /100 | #80 | Exceptional 93.7% |
| Immigrants | Moldova | 99.5 /100 | #81 | Exceptional 93.7% |
| Immigrants | Saudi Arabia | 99.3 /100 | #82 | Exceptional 93.7% |
| Icelanders | 99.3 /100 | #83 | Exceptional 93.6% |
Demographics Similar to Immigrants from Canada by 11th Grade
In terms of 11th grade, the demographic groups most similar to Immigrants from Canada are Turkish (94.0%, a difference of 0.010%), Immigrants from Australia (94.0%, a difference of 0.010%), Immigrants from North America (94.0%, a difference of 0.020%), Czechoslovakian (94.0%, a difference of 0.020%), and French Canadian (94.0%, a difference of 0.030%).
| Demographics | Rating | Rank | 11th Grade |
| Australians | 99.9 /100 | #45 | Exceptional 94.1% |
| Serbians | 99.9 /100 | #46 | Exceptional 94.1% |
| Filipinos | 99.9 /100 | #47 | Exceptional 94.1% |
| Macedonians | 99.9 /100 | #48 | Exceptional 94.1% |
| Slavs | 99.9 /100 | #49 | Exceptional 94.1% |
| French | 99.9 /100 | #50 | Exceptional 94.1% |
| Turks | 99.9 /100 | #51 | Exceptional 94.0% |
| Immigrants | Canada | 99.9 /100 | #52 | Exceptional 94.0% |
| Immigrants | Australia | 99.9 /100 | #53 | Exceptional 94.0% |
| Immigrants | North America | 99.9 /100 | #54 | Exceptional 94.0% |
| Czechoslovakians | 99.9 /100 | #55 | Exceptional 94.0% |
| French Canadians | 99.9 /100 | #56 | Exceptional 94.0% |
| New Zealanders | 99.9 /100 | #57 | Exceptional 94.0% |
| Iranians | 99.9 /100 | #58 | Exceptional 94.0% |
| Bhutanese | 99.8 /100 | #59 | Exceptional 94.0% |