Finnish vs Immigrants from Australia Unemployment Among Ages 55 to 59 years
COMPARE
Finnish
Immigrants from Australia
Unemployment Among Ages 55 to 59 years
Unemployment Among Ages 55 to 59 years Comparison
Finns
Immigrants from Australia
4.6%
UNEMPLOYMENT AMONG AGES 55 TO 59 YEARS
98.2/ 100
METRIC RATING
78th/ 347
METRIC RANK
4.9%
UNEMPLOYMENT AMONG AGES 55 TO 59 YEARS
14.1/ 100
METRIC RATING
207th/ 347
METRIC RANK
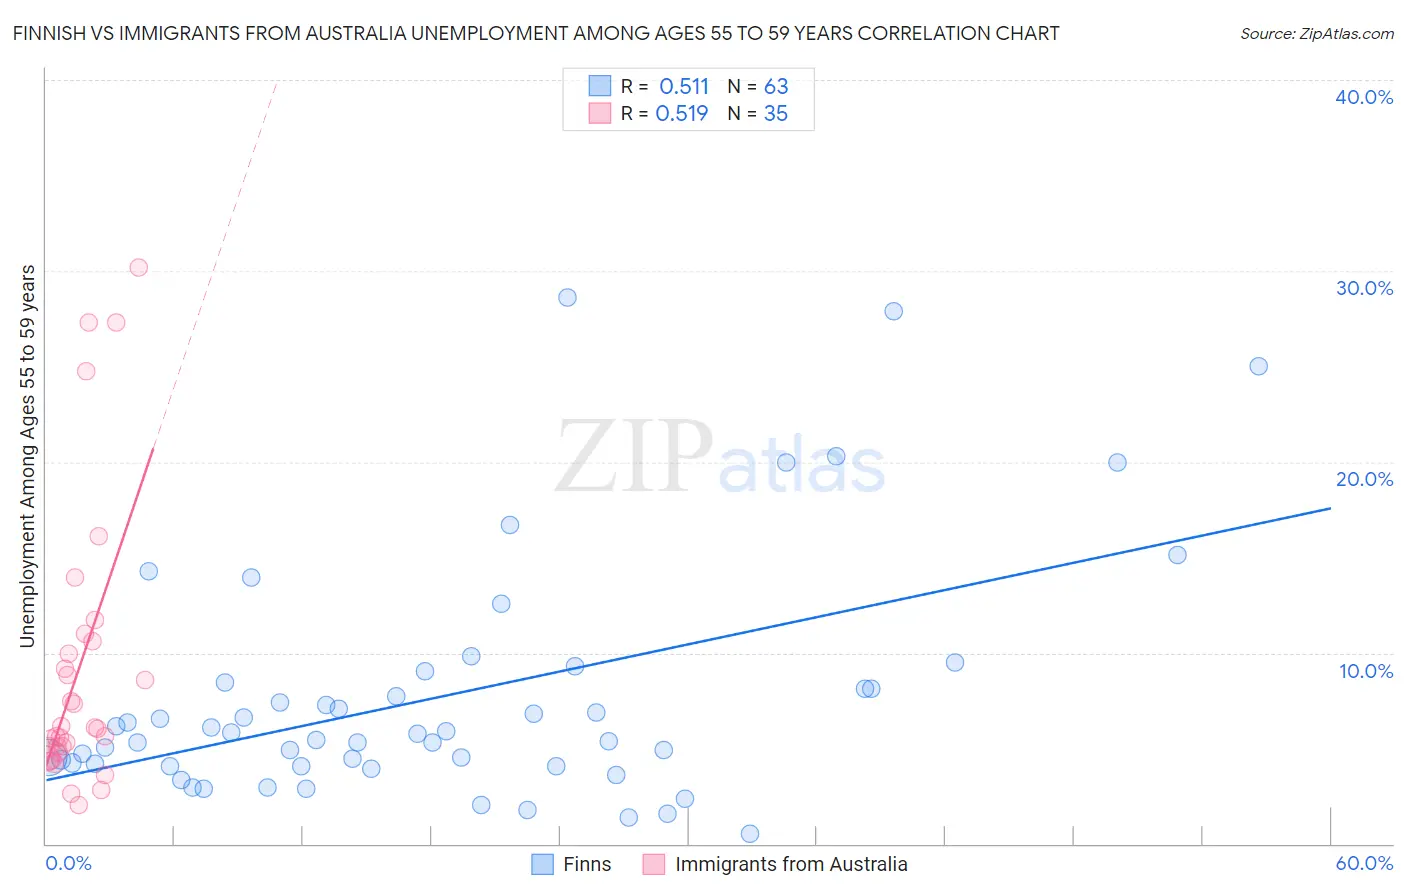
Finnish vs Immigrants from Australia Unemployment Among Ages 55 to 59 years Correlation Chart
The statistical analysis conducted on geographies consisting of 369,968,764 people shows a substantial positive correlation between the proportion of Finns and unemployment rate among population between the ages 55 and 59 in the United States with a correlation coefficient (R) of 0.511 and weighted average of 4.6%. Similarly, the statistical analysis conducted on geographies consisting of 217,293,079 people shows a substantial positive correlation between the proportion of Immigrants from Australia and unemployment rate among population between the ages 55 and 59 in the United States with a correlation coefficient (R) of 0.519 and weighted average of 4.9%, a difference of 6.2%.
Unemployment Among Ages 55 to 59 years Correlation Summary
| Measurement | Finnish | Immigrants from Australia |
| Minimum | 0.50% | 2.0% |
| Maximum | 28.6% | 30.2% |
| Range | 28.1% | 28.2% |
| Mean | 7.7% | 9.1% |
| Median | 5.8% | 6.0% |
| Interquartile 25% (IQ1) | 4.0% | 4.8% |
| Interquartile 75% (IQ3) | 8.4% | 10.6% |
| Interquartile Range (IQR) | 4.4% | 5.8% |
| Standard Deviation (Sample) | 6.2% | 7.4% |
| Standard Deviation (Population) | 6.2% | 7.3% |
Similar Demographics by Unemployment Among Ages 55 to 59 years
Demographics Similar to Finns by Unemployment Among Ages 55 to 59 years
In terms of unemployment among ages 55 to 59 years, the demographic groups most similar to Finns are Scotch-Irish (4.6%, a difference of 0.050%), Immigrants from Bosnia and Herzegovina (4.6%, a difference of 0.060%), Sri Lankan (4.6%, a difference of 0.090%), Immigrants from Iraq (4.6%, a difference of 0.13%), and Cambodian (4.6%, a difference of 0.13%).
| Demographics | Rating | Rank | Unemployment Among Ages 55 to 59 years |
| Immigrants | Jordan | 98.7 /100 | #71 | Exceptional 4.6% |
| Immigrants | Taiwan | 98.7 /100 | #72 | Exceptional 4.6% |
| Bhutanese | 98.6 /100 | #73 | Exceptional 4.6% |
| Croatians | 98.5 /100 | #74 | Exceptional 4.6% |
| Immigrants | Iraq | 98.5 /100 | #75 | Exceptional 4.6% |
| Immigrants | Bosnia and Herzegovina | 98.3 /100 | #76 | Exceptional 4.6% |
| Scotch-Irish | 98.3 /100 | #77 | Exceptional 4.6% |
| Finns | 98.2 /100 | #78 | Exceptional 4.6% |
| Sri Lankans | 98.1 /100 | #79 | Exceptional 4.6% |
| Cambodians | 98.0 /100 | #80 | Exceptional 4.6% |
| Taiwanese | 97.9 /100 | #81 | Exceptional 4.6% |
| Latvians | 97.8 /100 | #82 | Exceptional 4.6% |
| Lebanese | 97.5 /100 | #83 | Exceptional 4.6% |
| Malaysians | 96.9 /100 | #84 | Exceptional 4.7% |
| Immigrants | Vietnam | 96.9 /100 | #85 | Exceptional 4.7% |
Demographics Similar to Immigrants from Australia by Unemployment Among Ages 55 to 59 years
In terms of unemployment among ages 55 to 59 years, the demographic groups most similar to Immigrants from Australia are Immigrants from Belarus (4.9%, a difference of 0.0%), Immigrants from Kazakhstan (4.9%, a difference of 0.010%), Immigrants from Haiti (4.9%, a difference of 0.070%), Creek (4.9%, a difference of 0.10%), and Hawaiian (4.9%, a difference of 0.11%).
| Demographics | Rating | Rank | Unemployment Among Ages 55 to 59 years |
| Basques | 23.3 /100 | #200 | Fair 4.9% |
| Immigrants | South America | 23.1 /100 | #201 | Fair 4.9% |
| Lumbee | 22.5 /100 | #202 | Fair 4.9% |
| Guamanians/Chamorros | 20.8 /100 | #203 | Fair 4.9% |
| Immigrants | Latvia | 18.5 /100 | #204 | Poor 4.9% |
| Haitians | 18.1 /100 | #205 | Poor 4.9% |
| Immigrants | Belarus | 14.1 /100 | #206 | Poor 4.9% |
| Immigrants | Australia | 14.1 /100 | #207 | Poor 4.9% |
| Immigrants | Kazakhstan | 14.0 /100 | #208 | Poor 4.9% |
| Immigrants | Haiti | 13.3 /100 | #209 | Poor 4.9% |
| Creek | 12.9 /100 | #210 | Poor 4.9% |
| Hawaiians | 12.8 /100 | #211 | Poor 4.9% |
| Immigrants | Nonimmigrants | 11.2 /100 | #212 | Poor 4.9% |
| Bermudans | 11.0 /100 | #213 | Poor 4.9% |
| Immigrants | Denmark | 10.3 /100 | #214 | Poor 4.9% |