Immigrants from South Central Asia vs Immigrants from Africa Bachelor's Degree
COMPARE
Immigrants from South Central Asia
Immigrants from Africa
Bachelor's Degree
Bachelor's Degree Comparison
Immigrants from South Central Asia
Immigrants from Africa
48.3%
BACHELOR'S DEGREE
100.0/ 100
METRIC RATING
13th/ 347
METRIC RANK
38.9%
BACHELOR'S DEGREE
76.5/ 100
METRIC RATING
151st/ 347
METRIC RANK
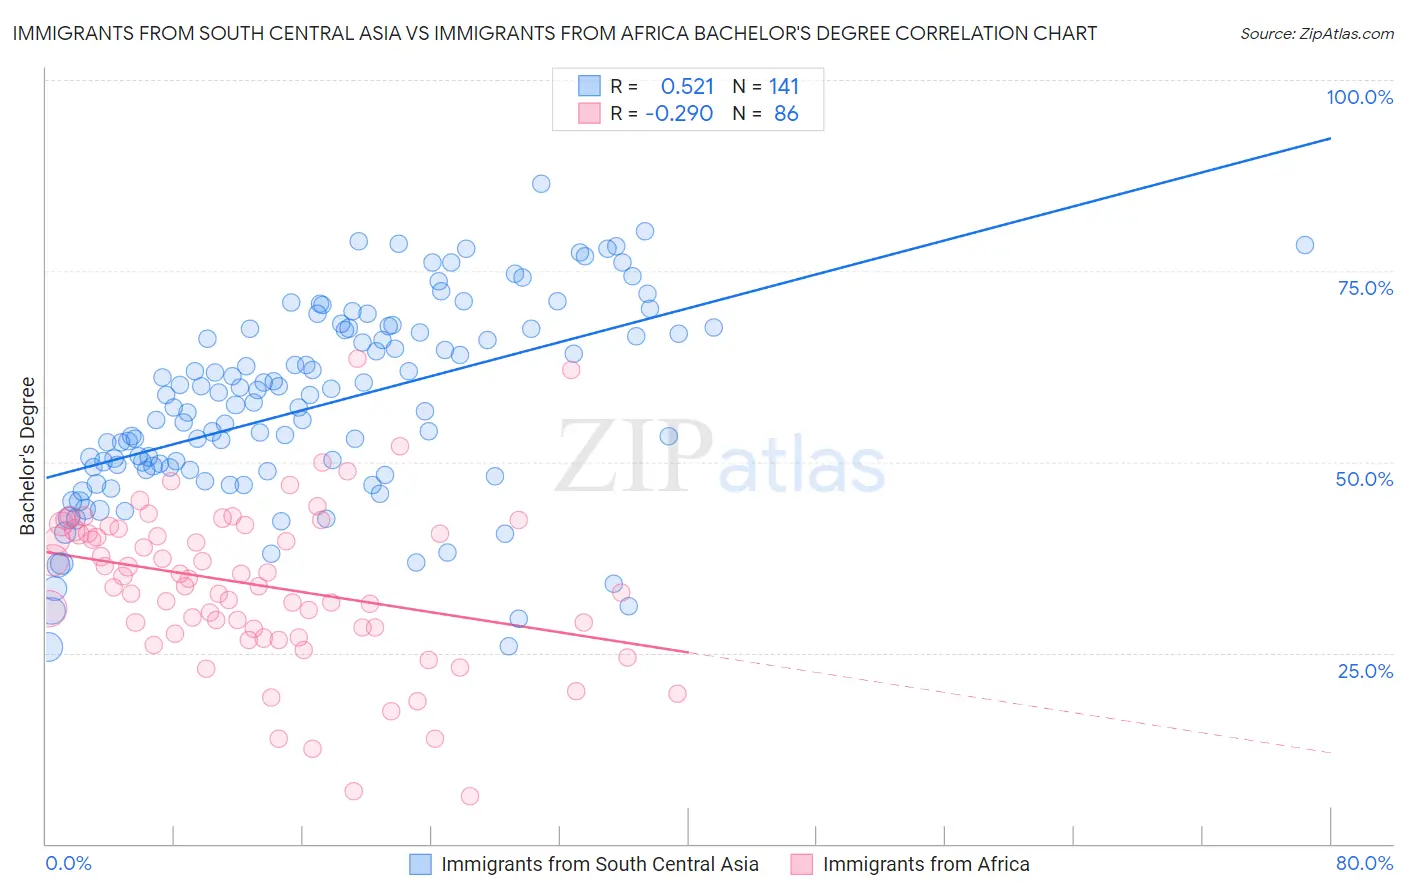
Immigrants from South Central Asia vs Immigrants from Africa Bachelor's Degree Correlation Chart
The statistical analysis conducted on geographies consisting of 473,040,508 people shows a substantial positive correlation between the proportion of Immigrants from South Central Asia and percentage of population with at least bachelor's degree education in the United States with a correlation coefficient (R) of 0.521 and weighted average of 48.3%. Similarly, the statistical analysis conducted on geographies consisting of 469,379,940 people shows a weak negative correlation between the proportion of Immigrants from Africa and percentage of population with at least bachelor's degree education in the United States with a correlation coefficient (R) of -0.290 and weighted average of 38.9%, a difference of 24.2%.
Bachelor's Degree Correlation Summary
| Measurement | Immigrants from South Central Asia | Immigrants from Africa |
| Minimum | 25.8% | 6.2% |
| Maximum | 86.5% | 63.5% |
| Range | 60.7% | 57.3% |
| Mean | 57.3% | 33.9% |
| Median | 57.4% | 34.2% |
| Interquartile 25% (IQ1) | 49.0% | 28.2% |
| Interquartile 75% (IQ3) | 67.3% | 41.0% |
| Interquartile Range (IQR) | 18.3% | 12.9% |
| Standard Deviation (Sample) | 12.7% | 10.5% |
| Standard Deviation (Population) | 12.7% | 10.4% |
Similar Demographics by Bachelor's Degree
Demographics Similar to Immigrants from South Central Asia by Bachelor's Degree
In terms of bachelor's degree, the demographic groups most similar to Immigrants from South Central Asia are Immigrants from China (48.4%, a difference of 0.14%), Immigrants from Hong Kong (48.2%, a difference of 0.28%), Immigrants from Australia (48.5%, a difference of 0.32%), Immigrants from Eastern Asia (48.1%, a difference of 0.42%), and Soviet Union (47.9%, a difference of 0.88%).
| Demographics | Rating | Rank | Bachelor's Degree |
| Okinawans | 100.0 /100 | #6 | Exceptional 50.5% |
| Immigrants | Iran | 100.0 /100 | #7 | Exceptional 50.3% |
| Thais | 100.0 /100 | #8 | Exceptional 50.1% |
| Immigrants | Israel | 100.0 /100 | #9 | Exceptional 50.0% |
| Cypriots | 100.0 /100 | #10 | Exceptional 49.0% |
| Immigrants | Australia | 100.0 /100 | #11 | Exceptional 48.5% |
| Immigrants | China | 100.0 /100 | #12 | Exceptional 48.4% |
| Immigrants | South Central Asia | 100.0 /100 | #13 | Exceptional 48.3% |
| Immigrants | Hong Kong | 100.0 /100 | #14 | Exceptional 48.2% |
| Immigrants | Eastern Asia | 100.0 /100 | #15 | Exceptional 48.1% |
| Soviet Union | 100.0 /100 | #16 | Exceptional 47.9% |
| Eastern Europeans | 100.0 /100 | #17 | Exceptional 47.5% |
| Indians (Asian) | 100.0 /100 | #18 | Exceptional 47.4% |
| Cambodians | 100.0 /100 | #19 | Exceptional 47.2% |
| Immigrants | Switzerland | 100.0 /100 | #20 | Exceptional 47.1% |
Demographics Similar to Immigrants from Africa by Bachelor's Degree
In terms of bachelor's degree, the demographic groups most similar to Immigrants from Africa are Sudanese (38.9%, a difference of 0.020%), Slavic (38.9%, a difference of 0.080%), South American (38.9%, a difference of 0.10%), Immigrants from Poland (39.0%, a difference of 0.13%), and Canadian (38.8%, a difference of 0.20%).
| Demographics | Rating | Rank | Bachelor's Degree |
| Immigrants | Afghanistan | 79.7 /100 | #144 | Good 39.1% |
| Slovenes | 79.5 /100 | #145 | Good 39.1% |
| Swedes | 79.2 /100 | #146 | Good 39.1% |
| Immigrants | Sierra Leone | 79.0 /100 | #147 | Good 39.0% |
| Iraqis | 78.1 /100 | #148 | Good 39.0% |
| Immigrants | Poland | 77.5 /100 | #149 | Good 39.0% |
| South Americans | 77.3 /100 | #150 | Good 38.9% |
| Immigrants | Africa | 76.5 /100 | #151 | Good 38.9% |
| Sudanese | 76.4 /100 | #152 | Good 38.9% |
| Slavs | 75.9 /100 | #153 | Good 38.9% |
| Canadians | 75.0 /100 | #154 | Good 38.8% |
| Immigrants | Kenya | 73.8 /100 | #155 | Good 38.8% |
| Kenyans | 72.5 /100 | #156 | Good 38.7% |
| Immigrants | South America | 70.1 /100 | #157 | Good 38.6% |
| Immigrants | Germany | 69.6 /100 | #158 | Good 38.6% |