Finnish vs Cheyenne Doctorate Degree
COMPARE
Finnish
Cheyenne
Doctorate Degree
Doctorate Degree Comparison
Finns
Cheyenne
1.8%
DOCTORATE DEGREE
42.1/ 100
METRIC RATING
183rd/ 347
METRIC RANK
1.6%
DOCTORATE DEGREE
2.3/ 100
METRIC RATING
241st/ 347
METRIC RANK
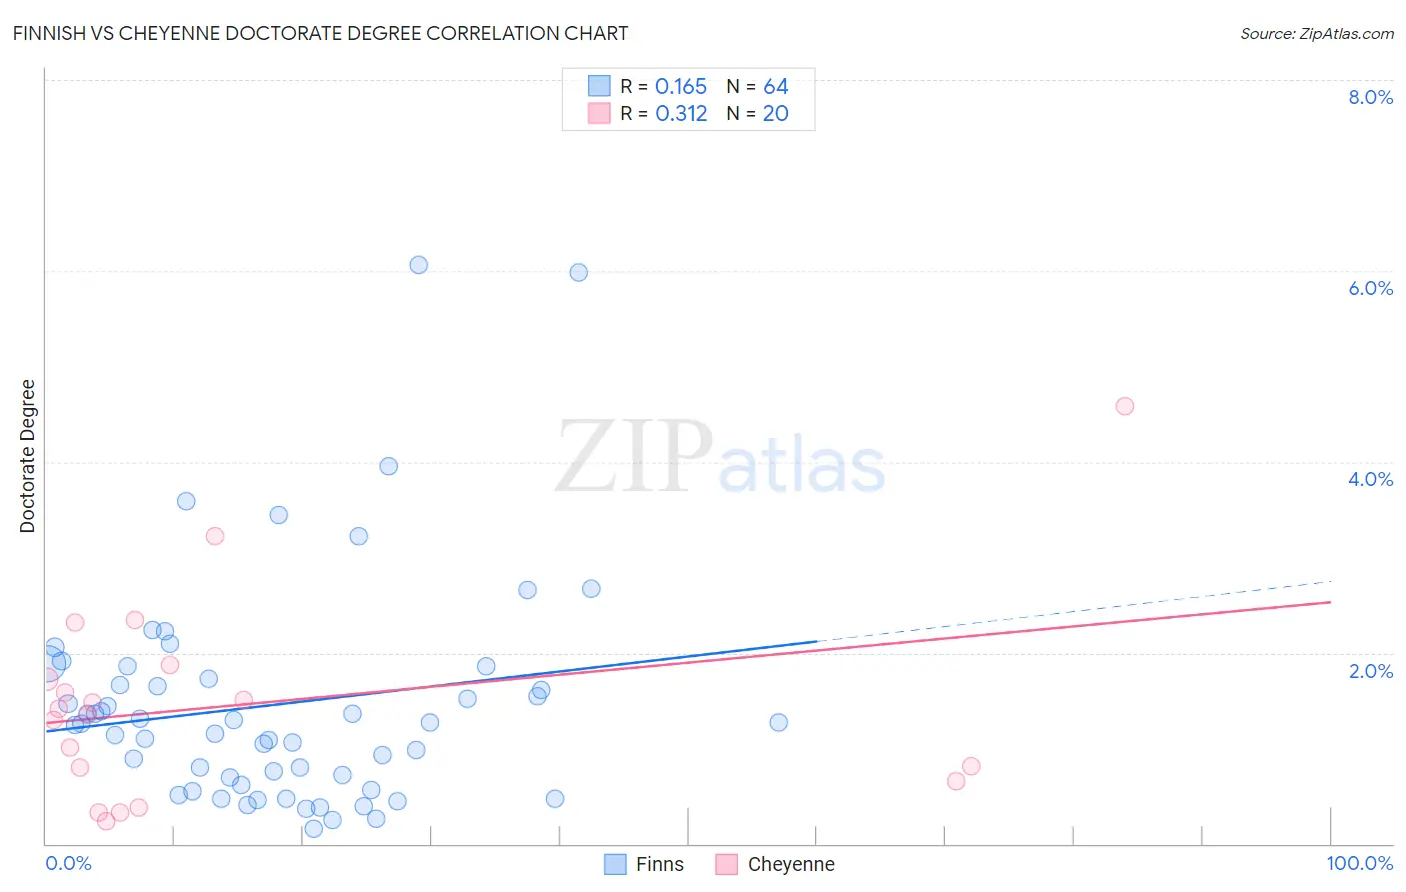
Finnish vs Cheyenne Doctorate Degree Correlation Chart
The statistical analysis conducted on geographies consisting of 399,063,308 people shows a poor positive correlation between the proportion of Finns and percentage of population with at least doctorate degree education in the United States with a correlation coefficient (R) of 0.165 and weighted average of 1.8%. Similarly, the statistical analysis conducted on geographies consisting of 80,230,104 people shows a mild positive correlation between the proportion of Cheyenne and percentage of population with at least doctorate degree education in the United States with a correlation coefficient (R) of 0.312 and weighted average of 1.6%, a difference of 14.5%.
Doctorate Degree Correlation Summary
| Measurement | Finnish | Cheyenne |
| Minimum | 0.15% | 0.23% |
| Maximum | 6.1% | 4.6% |
| Range | 5.9% | 4.4% |
| Mean | 1.5% | 1.5% |
| Median | 1.3% | 1.4% |
| Interquartile 25% (IQ1) | 0.66% | 0.72% |
| Interquartile 75% (IQ3) | 1.8% | 1.8% |
| Interquartile Range (IQR) | 1.1% | 1.1% |
| Standard Deviation (Sample) | 1.2% | 1.1% |
| Standard Deviation (Population) | 1.2% | 1.0% |
Similar Demographics by Doctorate Degree
Demographics Similar to Finns by Doctorate Degree
In terms of doctorate degree, the demographic groups most similar to Finns are Nigerian (1.8%, a difference of 0.33%), Immigrants from Afghanistan (1.8%, a difference of 0.34%), Immigrants (1.8%, a difference of 0.63%), Scandinavian (1.8%, a difference of 0.89%), and Slovak (1.8%, a difference of 0.90%).
| Demographics | Rating | Rank | Doctorate Degree |
| Spanish | 49.3 /100 | #176 | Average 1.8% |
| Iraqis | 49.2 /100 | #177 | Average 1.8% |
| French | 48.8 /100 | #178 | Average 1.8% |
| Ghanaians | 48.3 /100 | #179 | Average 1.8% |
| Scandinavians | 48.0 /100 | #180 | Average 1.8% |
| Immigrants | Immigrants | 46.2 /100 | #181 | Average 1.8% |
| Immigrants | Afghanistan | 44.3 /100 | #182 | Average 1.8% |
| Finns | 42.1 /100 | #183 | Average 1.8% |
| Nigerians | 39.9 /100 | #184 | Fair 1.8% |
| Slovaks | 36.4 /100 | #185 | Fair 1.8% |
| Peruvians | 34.4 /100 | #186 | Fair 1.8% |
| Czechoslovakians | 33.0 /100 | #187 | Fair 1.8% |
| Germans | 30.5 /100 | #188 | Fair 1.8% |
| French Canadians | 30.2 /100 | #189 | Fair 1.8% |
| Immigrants | Costa Rica | 30.2 /100 | #190 | Fair 1.8% |
Demographics Similar to Cheyenne by Doctorate Degree
In terms of doctorate degree, the demographic groups most similar to Cheyenne are Immigrants from Panama (1.6%, a difference of 0.19%), Ottawa (1.6%, a difference of 0.21%), Native Hawaiian (1.6%, a difference of 0.34%), West Indian (1.6%, a difference of 0.38%), and Immigrants from Congo (1.6%, a difference of 0.48%).
| Demographics | Rating | Rank | Doctorate Degree |
| Hopi | 3.2 /100 | #234 | Tragic 1.6% |
| Cree | 3.0 /100 | #235 | Tragic 1.6% |
| Indonesians | 2.8 /100 | #236 | Tragic 1.6% |
| Iroquois | 2.7 /100 | #237 | Tragic 1.6% |
| Immigrants | Congo | 2.6 /100 | #238 | Tragic 1.6% |
| West Indians | 2.5 /100 | #239 | Tragic 1.6% |
| Immigrants | Panama | 2.4 /100 | #240 | Tragic 1.6% |
| Cheyenne | 2.3 /100 | #241 | Tragic 1.6% |
| Ottawa | 2.2 /100 | #242 | Tragic 1.6% |
| Native Hawaiians | 2.1 /100 | #243 | Tragic 1.6% |
| French American Indians | 2.0 /100 | #244 | Tragic 1.6% |
| Delaware | 1.9 /100 | #245 | Tragic 1.6% |
| Hmong | 1.8 /100 | #246 | Tragic 1.6% |
| Comanche | 1.8 /100 | #247 | Tragic 1.6% |
| Africans | 1.8 /100 | #248 | Tragic 1.6% |