Fijian vs Immigrants from El Salvador 3rd Grade
COMPARE
Fijian
Immigrants from El Salvador
3rd Grade
3rd Grade Comparison
Fijians
Immigrants from El Salvador
97.3%
3RD GRADE
0.2/ 100
METRIC RATING
269th/ 347
METRIC RANK
95.5%
3RD GRADE
0.0/ 100
METRIC RATING
346th/ 347
METRIC RANK
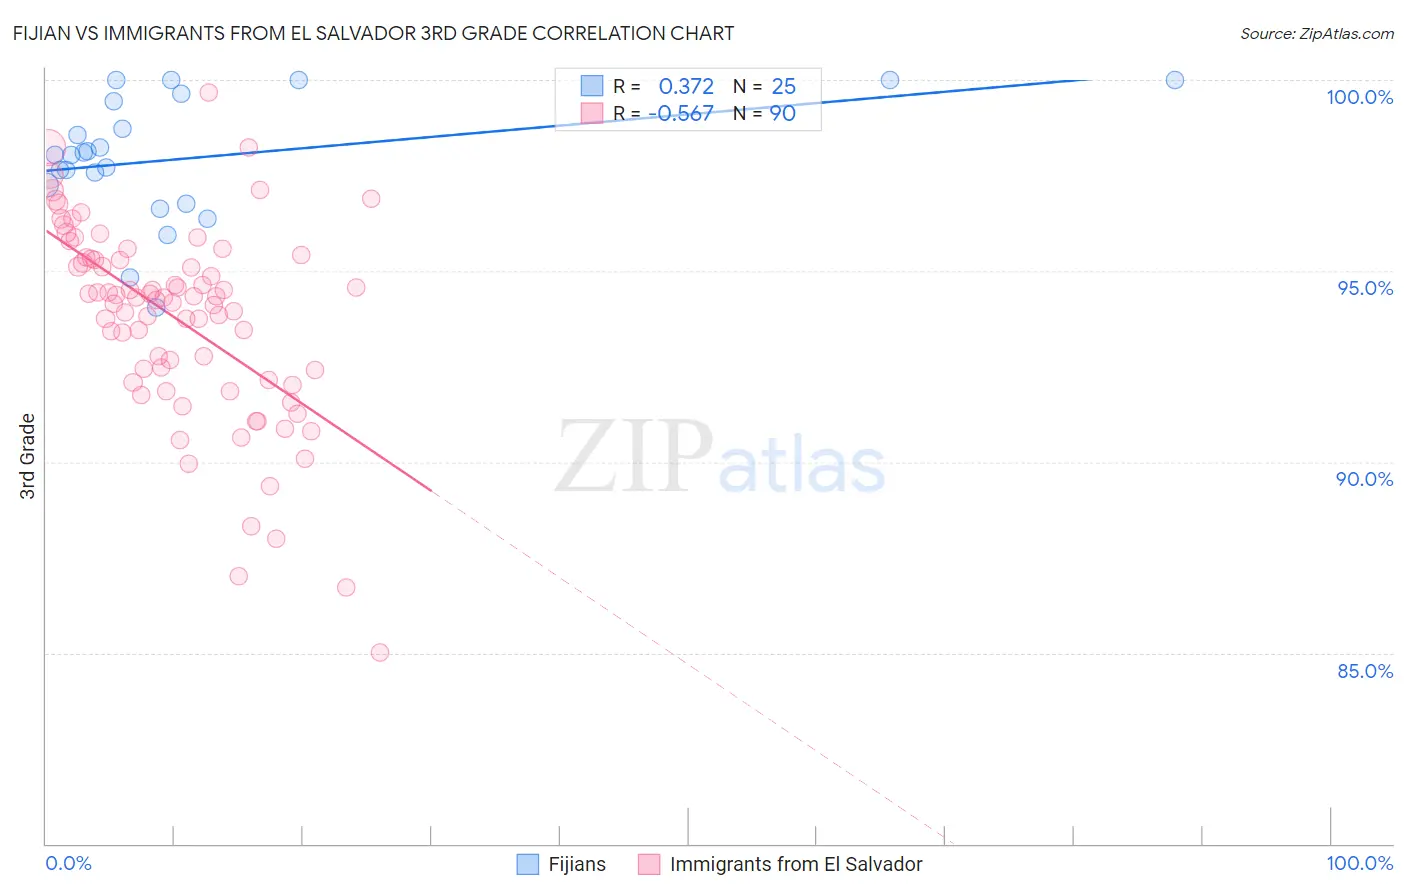
Fijian vs Immigrants from El Salvador 3rd Grade Correlation Chart
The statistical analysis conducted on geographies consisting of 55,948,842 people shows a mild positive correlation between the proportion of Fijians and percentage of population with at least 3rd grade education in the United States with a correlation coefficient (R) of 0.372 and weighted average of 97.3%. Similarly, the statistical analysis conducted on geographies consisting of 357,852,938 people shows a substantial negative correlation between the proportion of Immigrants from El Salvador and percentage of population with at least 3rd grade education in the United States with a correlation coefficient (R) of -0.567 and weighted average of 95.5%, a difference of 1.8%.
3rd Grade Correlation Summary
| Measurement | Fijian | Immigrants from El Salvador |
| Minimum | 94.1% | 85.0% |
| Maximum | 100.0% | 99.7% |
| Range | 5.9% | 14.7% |
| Mean | 98.0% | 93.7% |
| Median | 98.0% | 94.3% |
| Interquartile 25% (IQ1) | 97.0% | 92.1% |
| Interquartile 75% (IQ3) | 99.5% | 95.3% |
| Interquartile Range (IQR) | 2.5% | 3.2% |
| Standard Deviation (Sample) | 1.6% | 2.6% |
| Standard Deviation (Population) | 1.6% | 2.6% |
Similar Demographics by 3rd Grade
Demographics Similar to Fijians by 3rd Grade
In terms of 3rd grade, the demographic groups most similar to Fijians are Cuban (97.3%, a difference of 0.0%), Yaqui (97.3%, a difference of 0.010%), Immigrants from Nigeria (97.3%, a difference of 0.010%), Immigrants from Jamaica (97.3%, a difference of 0.020%), and Taiwanese (97.3%, a difference of 0.030%).
| Demographics | Rating | Rank | 3rd Grade |
| Immigrants | Sierra Leone | 0.4 /100 | #262 | Tragic 97.3% |
| Taiwanese | 0.3 /100 | #263 | Tragic 97.3% |
| West Indians | 0.3 /100 | #264 | Tragic 97.3% |
| Immigrants | Jamaica | 0.3 /100 | #265 | Tragic 97.3% |
| Yaqui | 0.3 /100 | #266 | Tragic 97.3% |
| Immigrants | Nigeria | 0.3 /100 | #267 | Tragic 97.3% |
| Cubans | 0.2 /100 | #268 | Tragic 97.3% |
| Fijians | 0.2 /100 | #269 | Tragic 97.3% |
| Immigrants | China | 0.2 /100 | #270 | Tragic 97.2% |
| Puerto Ricans | 0.2 /100 | #271 | Tragic 97.2% |
| Ghanaians | 0.1 /100 | #272 | Tragic 97.2% |
| Immigrants | Peru | 0.1 /100 | #273 | Tragic 97.2% |
| Immigrants | Cameroon | 0.1 /100 | #274 | Tragic 97.2% |
| Immigrants | Uzbekistan | 0.1 /100 | #275 | Tragic 97.2% |
| Immigrants | Bolivia | 0.1 /100 | #276 | Tragic 97.2% |
Demographics Similar to Immigrants from El Salvador by 3rd Grade
In terms of 3rd grade, the demographic groups most similar to Immigrants from El Salvador are Immigrants from Yemen (95.6%, a difference of 0.060%), Salvadoran (95.7%, a difference of 0.19%), Spanish American Indian (95.3%, a difference of 0.26%), Immigrants from Mexico (95.8%, a difference of 0.30%), and Immigrants from Central America (95.8%, a difference of 0.33%).
| Demographics | Rating | Rank | 3rd Grade |
| Immigrants | Fiji | 0.0 /100 | #333 | Tragic 96.2% |
| Immigrants | Cambodia | 0.0 /100 | #334 | Tragic 96.2% |
| Immigrants | Dominican Republic | 0.0 /100 | #335 | Tragic 96.2% |
| Immigrants | Cabo Verde | 0.0 /100 | #336 | Tragic 96.2% |
| Central Americans | 0.0 /100 | #337 | Tragic 96.1% |
| Guatemalans | 0.0 /100 | #338 | Tragic 96.0% |
| Yakama | 0.0 /100 | #339 | Tragic 95.9% |
| Nepalese | 0.0 /100 | #340 | Tragic 95.9% |
| Immigrants | Central America | 0.0 /100 | #341 | Tragic 95.8% |
| Immigrants | Guatemala | 0.0 /100 | #342 | Tragic 95.8% |
| Immigrants | Mexico | 0.0 /100 | #343 | Tragic 95.8% |
| Salvadorans | 0.0 /100 | #344 | Tragic 95.7% |
| Immigrants | Yemen | 0.0 /100 | #345 | Tragic 95.6% |
| Immigrants | El Salvador | 0.0 /100 | #346 | Tragic 95.5% |
| Spanish American Indians | 0.0 /100 | #347 | Tragic 95.3% |