Tongan vs Immigrants from Peru 11th Grade
COMPARE
Tongan
Immigrants from Peru
11th Grade
11th Grade Comparison
Tongans
Immigrants from Peru
92.2%
11TH GRADE
19.8/ 100
METRIC RATING
209th/ 347
METRIC RANK
91.0%
11TH GRADE
0.1/ 100
METRIC RATING
271st/ 347
METRIC RANK
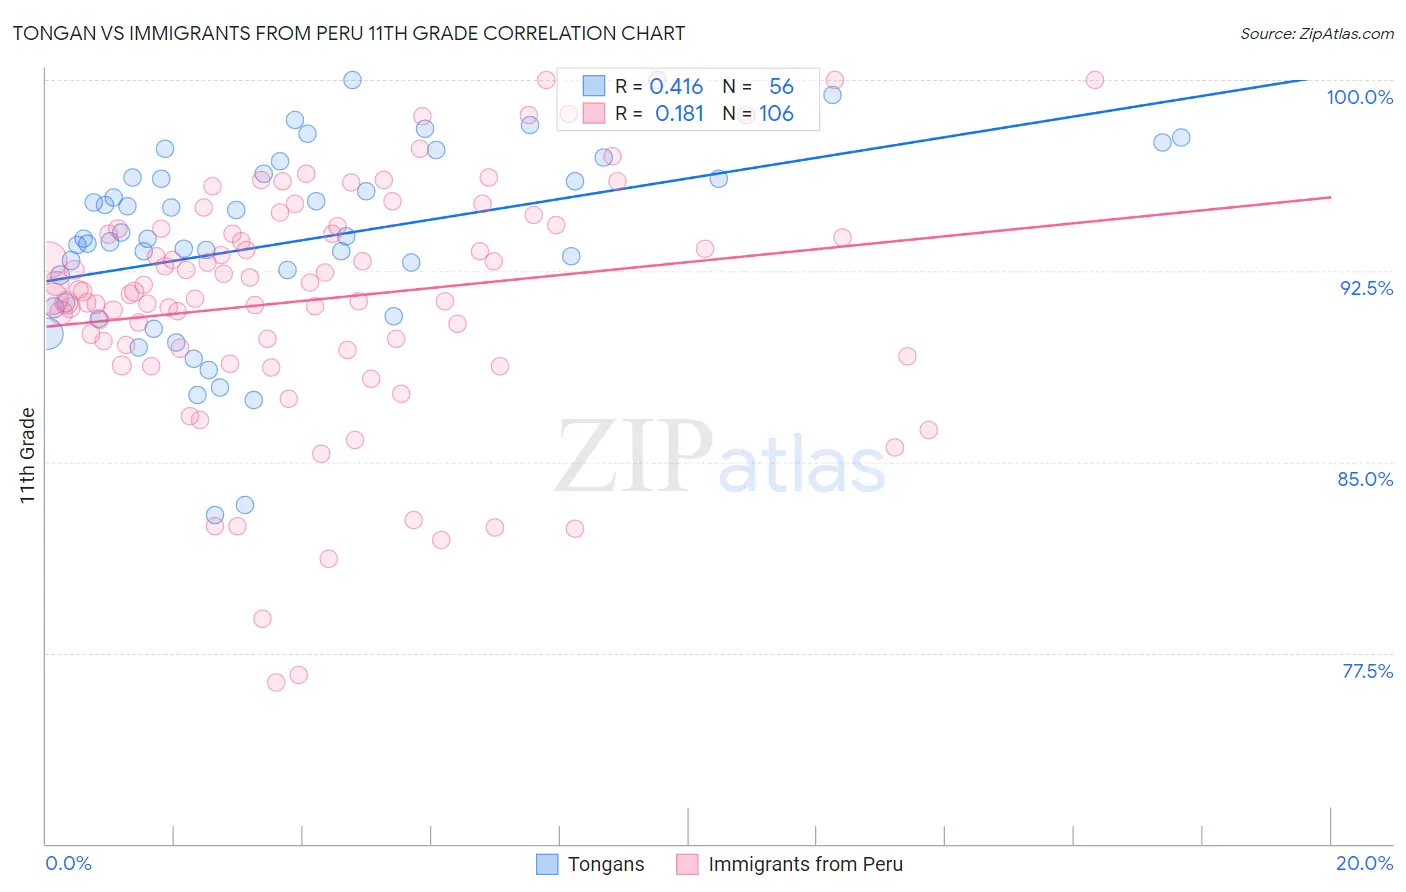
Tongan vs Immigrants from Peru 11th Grade Correlation Chart
The statistical analysis conducted on geographies consisting of 102,873,790 people shows a moderate positive correlation between the proportion of Tongans and percentage of population with at least 11th grade education in the United States with a correlation coefficient (R) of 0.416 and weighted average of 92.2%. Similarly, the statistical analysis conducted on geographies consisting of 328,860,880 people shows a poor positive correlation between the proportion of Immigrants from Peru and percentage of population with at least 11th grade education in the United States with a correlation coefficient (R) of 0.181 and weighted average of 91.0%, a difference of 1.3%.
11th Grade Correlation Summary
| Measurement | Tongan | Immigrants from Peru |
| Minimum | 82.9% | 76.3% |
| Maximum | 100.0% | 100.0% |
| Range | 17.1% | 23.7% |
| Mean | 93.6% | 91.4% |
| Median | 93.8% | 91.7% |
| Interquartile 25% (IQ1) | 91.2% | 89.5% |
| Interquartile 75% (IQ3) | 96.2% | 94.2% |
| Interquartile Range (IQR) | 5.0% | 4.7% |
| Standard Deviation (Sample) | 3.7% | 4.8% |
| Standard Deviation (Population) | 3.7% | 4.7% |
Similar Demographics by 11th Grade
Demographics Similar to Tongans by 11th Grade
In terms of 11th grade, the demographic groups most similar to Tongans are Ethiopian (92.2%, a difference of 0.010%), Colville (92.2%, a difference of 0.030%), Immigrants from Micronesia (92.2%, a difference of 0.030%), Immigrants from Oceania (92.2%, a difference of 0.040%), and Immigrants from Sudan (92.3%, a difference of 0.050%).
| Demographics | Rating | Rank | 11th Grade |
| Immigrants | Eastern Africa | 24.1 /100 | #202 | Fair 92.3% |
| Immigrants | Sudan | 23.5 /100 | #203 | Fair 92.3% |
| Immigrants | Hong Kong | 23.3 /100 | #204 | Fair 92.2% |
| Kiowa | 23.2 /100 | #205 | Fair 92.2% |
| Bolivians | 23.2 /100 | #206 | Fair 92.2% |
| Immigrants | Oceania | 22.4 /100 | #207 | Fair 92.2% |
| Colville | 21.8 /100 | #208 | Fair 92.2% |
| Tongans | 19.8 /100 | #209 | Poor 92.2% |
| Ethiopians | 18.8 /100 | #210 | Poor 92.2% |
| Immigrants | Micronesia | 17.7 /100 | #211 | Poor 92.2% |
| Koreans | 14.4 /100 | #212 | Poor 92.1% |
| Immigrants | Ethiopia | 13.9 /100 | #213 | Poor 92.1% |
| Afghans | 12.8 /100 | #214 | Poor 92.1% |
| Immigrants | Southern Europe | 12.5 /100 | #215 | Poor 92.1% |
| Somalis | 11.6 /100 | #216 | Poor 92.1% |
Demographics Similar to Immigrants from Peru by 11th Grade
In terms of 11th grade, the demographic groups most similar to Immigrants from Peru are West Indian (91.0%, a difference of 0.0%), Trinidadian and Tobagonian (91.1%, a difference of 0.030%), Paiute (91.0%, a difference of 0.050%), Ute (91.1%, a difference of 0.060%), and U.S. Virgin Islander (91.1%, a difference of 0.090%).
| Demographics | Rating | Rank | 11th Grade |
| Yup'ik | 0.3 /100 | #264 | Tragic 91.2% |
| Pueblo | 0.3 /100 | #265 | Tragic 91.2% |
| Immigrants | Western Africa | 0.3 /100 | #266 | Tragic 91.2% |
| Immigrants | Jamaica | 0.3 /100 | #267 | Tragic 91.2% |
| U.S. Virgin Islanders | 0.2 /100 | #268 | Tragic 91.1% |
| Ute | 0.2 /100 | #269 | Tragic 91.1% |
| Trinidadians and Tobagonians | 0.2 /100 | #270 | Tragic 91.1% |
| Immigrants | Peru | 0.1 /100 | #271 | Tragic 91.0% |
| West Indians | 0.1 /100 | #272 | Tragic 91.0% |
| Paiute | 0.1 /100 | #273 | Tragic 91.0% |
| Immigrants | Trinidad and Tobago | 0.1 /100 | #274 | Tragic 90.9% |
| Immigrants | South Eastern Asia | 0.1 /100 | #275 | Tragic 90.9% |
| Bangladeshis | 0.1 /100 | #276 | Tragic 90.9% |
| Immigrants | Congo | 0.1 /100 | #277 | Tragic 90.9% |
| Malaysians | 0.1 /100 | #278 | Tragic 90.8% |