European vs Immigrants from Bulgaria High School Diploma
COMPARE
European
Immigrants from Bulgaria
High School Diploma
High School Diploma Comparison
Europeans
Immigrants from Bulgaria
91.4%
HIGH SCHOOL DIPLOMA
99.9/ 100
METRIC RATING
29th/ 347
METRIC RANK
90.6%
HIGH SCHOOL DIPLOMA
98.9/ 100
METRIC RATING
86th/ 347
METRIC RANK
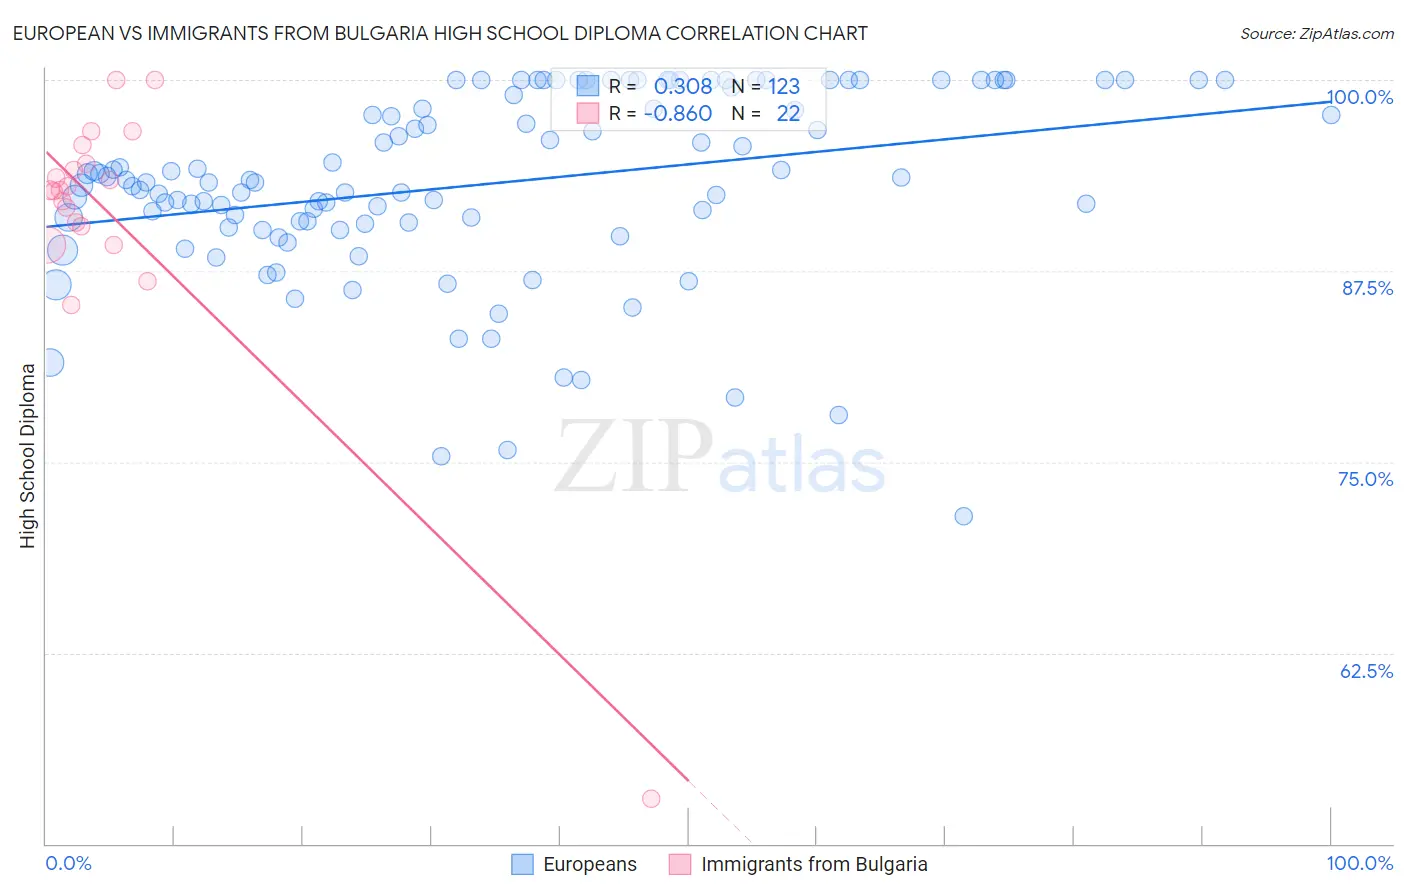
European vs Immigrants from Bulgaria High School Diploma Correlation Chart
The statistical analysis conducted on geographies consisting of 561,829,322 people shows a mild positive correlation between the proportion of Europeans and percentage of population with at least high school diploma education in the United States with a correlation coefficient (R) of 0.308 and weighted average of 91.4%. Similarly, the statistical analysis conducted on geographies consisting of 172,552,181 people shows a very strong negative correlation between the proportion of Immigrants from Bulgaria and percentage of population with at least high school diploma education in the United States with a correlation coefficient (R) of -0.860 and weighted average of 90.6%, a difference of 0.86%.
High School Diploma Correlation Summary
| Measurement | European | Immigrants from Bulgaria |
| Minimum | 71.4% | 52.9% |
| Maximum | 100.0% | 100.0% |
| Range | 28.6% | 47.1% |
| Mean | 93.2% | 91.1% |
| Median | 93.3% | 92.8% |
| Interquartile 25% (IQ1) | 90.6% | 90.5% |
| Interquartile 75% (IQ3) | 99.5% | 94.6% |
| Interquartile Range (IQR) | 8.9% | 4.1% |
| Standard Deviation (Sample) | 6.1% | 9.3% |
| Standard Deviation (Population) | 6.1% | 9.1% |
Similar Demographics by High School Diploma
Demographics Similar to Europeans by High School Diploma
In terms of high school diploma, the demographic groups most similar to Europeans are Iranian (91.4%, a difference of 0.010%), Immigrants from Northern Europe (91.4%, a difference of 0.010%), Tlingit-Haida (91.4%, a difference of 0.020%), English (91.4%, a difference of 0.020%), and Okinawan (91.4%, a difference of 0.020%).
| Demographics | Rating | Rank | High School Diploma |
| Estonians | 99.9 /100 | #22 | Exceptional 91.6% |
| Scandinavians | 99.9 /100 | #23 | Exceptional 91.5% |
| Italians | 99.9 /100 | #24 | Exceptional 91.5% |
| Thais | 99.9 /100 | #25 | Exceptional 91.5% |
| Russians | 99.9 /100 | #26 | Exceptional 91.5% |
| Cypriots | 99.9 /100 | #27 | Exceptional 91.5% |
| Tlingit-Haida | 99.9 /100 | #28 | Exceptional 91.4% |
| Europeans | 99.9 /100 | #29 | Exceptional 91.4% |
| Iranians | 99.9 /100 | #30 | Exceptional 91.4% |
| Immigrants | Northern Europe | 99.9 /100 | #31 | Exceptional 91.4% |
| English | 99.9 /100 | #32 | Exceptional 91.4% |
| Okinawans | 99.9 /100 | #33 | Exceptional 91.4% |
| Scottish | 99.9 /100 | #34 | Exceptional 91.4% |
| Irish | 99.9 /100 | #35 | Exceptional 91.4% |
| Tsimshian | 99.9 /100 | #36 | Exceptional 91.3% |
Demographics Similar to Immigrants from Bulgaria by High School Diploma
In terms of high school diploma, the demographic groups most similar to Immigrants from Bulgaria are Immigrants from Turkey (90.6%, a difference of 0.0%), Romanian (90.7%, a difference of 0.010%), Immigrants from France (90.6%, a difference of 0.020%), Canadian (90.6%, a difference of 0.040%), and Celtic (90.6%, a difference of 0.050%).
| Demographics | Rating | Rank | High School Diploma |
| Immigrants | Denmark | 99.3 /100 | #79 | Exceptional 90.8% |
| Immigrants | England | 99.3 /100 | #80 | Exceptional 90.8% |
| Immigrants | Switzerland | 99.3 /100 | #81 | Exceptional 90.8% |
| Scotch-Irish | 99.2 /100 | #82 | Exceptional 90.8% |
| Immigrants | Moldova | 99.2 /100 | #83 | Exceptional 90.7% |
| Immigrants | Saudi Arabia | 99.1 /100 | #84 | Exceptional 90.7% |
| Romanians | 98.9 /100 | #85 | Exceptional 90.7% |
| Immigrants | Bulgaria | 98.9 /100 | #86 | Exceptional 90.6% |
| Immigrants | Turkey | 98.9 /100 | #87 | Exceptional 90.6% |
| Immigrants | France | 98.8 /100 | #88 | Exceptional 90.6% |
| Canadians | 98.7 /100 | #89 | Exceptional 90.6% |
| Celtics | 98.7 /100 | #90 | Exceptional 90.6% |
| South Africans | 98.6 /100 | #91 | Exceptional 90.6% |
| Swiss | 98.6 /100 | #92 | Exceptional 90.6% |
| Immigrants | Western Europe | 98.6 /100 | #93 | Exceptional 90.6% |