Cherokee vs Lithuanian 9th Grade
COMPARE
Cherokee
Lithuanian
9th Grade
9th Grade Comparison
Cherokee
Lithuanians
95.4%
9TH GRADE
96.3/ 100
METRIC RATING
111th/ 347
METRIC RANK
96.6%
9TH GRADE
100.0/ 100
METRIC RATING
10th/ 347
METRIC RANK
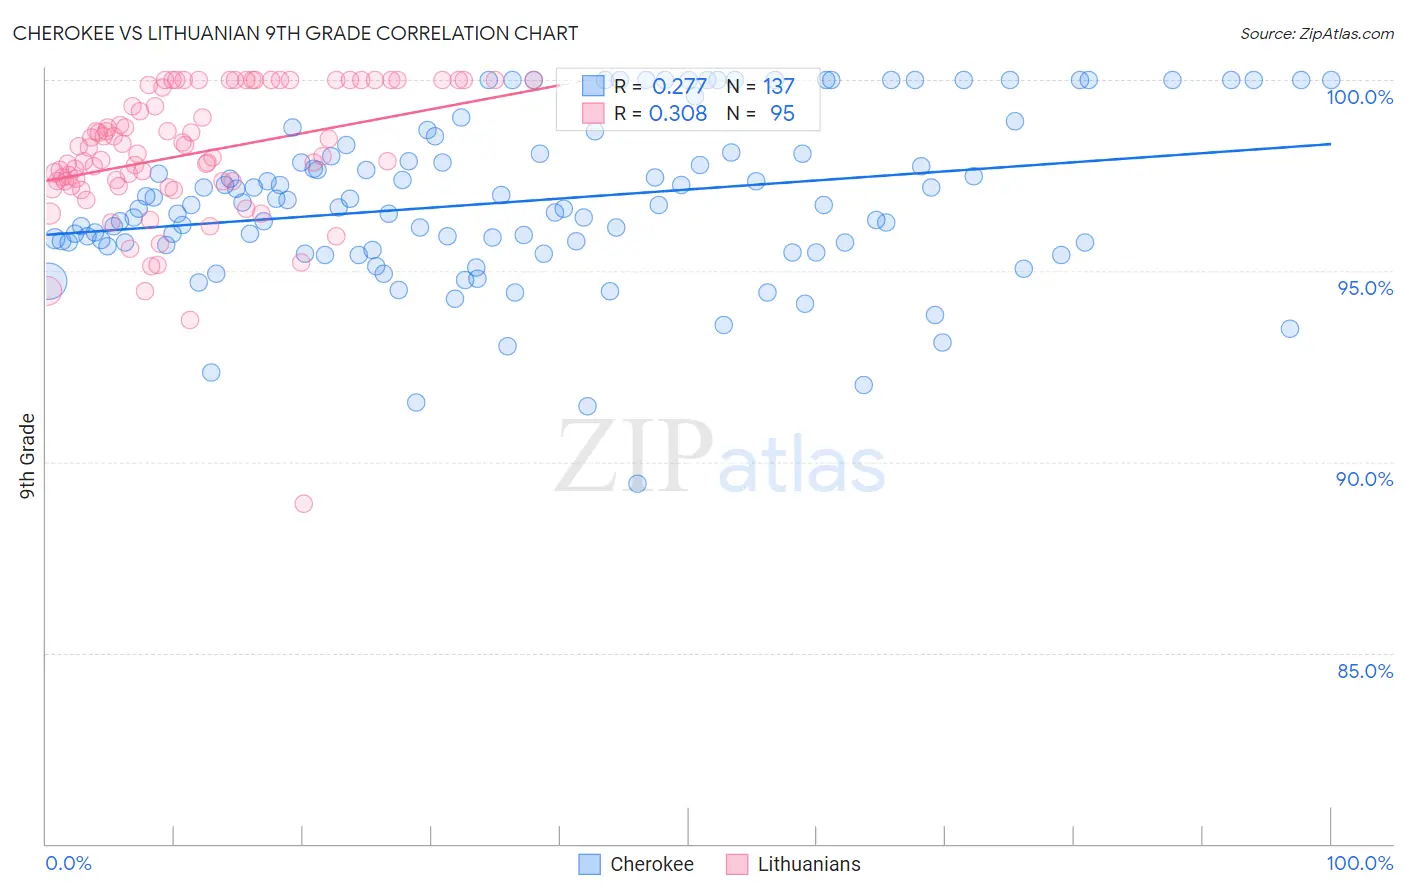
Cherokee vs Lithuanian 9th Grade Correlation Chart
The statistical analysis conducted on geographies consisting of 493,719,331 people shows a weak positive correlation between the proportion of Cherokee and percentage of population with at least 9th grade education in the United States with a correlation coefficient (R) of 0.277 and weighted average of 95.4%. Similarly, the statistical analysis conducted on geographies consisting of 421,947,524 people shows a mild positive correlation between the proportion of Lithuanians and percentage of population with at least 9th grade education in the United States with a correlation coefficient (R) of 0.308 and weighted average of 96.6%, a difference of 1.2%.
9th Grade Correlation Summary
| Measurement | Cherokee | Lithuanian |
| Minimum | 89.4% | 88.9% |
| Maximum | 100.0% | 100.0% |
| Range | 10.6% | 11.1% |
| Mean | 96.8% | 98.1% |
| Median | 96.7% | 98.1% |
| Interquartile 25% (IQ1) | 95.7% | 97.3% |
| Interquartile 75% (IQ3) | 98.1% | 100.0% |
| Interquartile Range (IQR) | 2.4% | 2.7% |
| Standard Deviation (Sample) | 2.1% | 1.8% |
| Standard Deviation (Population) | 2.1% | 1.8% |
Similar Demographics by 9th Grade
Demographics Similar to Cherokee by 9th Grade
In terms of 9th grade, the demographic groups most similar to Cherokee are Immigrants from Croatia (95.4%, a difference of 0.0%), Iroquois (95.4%, a difference of 0.010%), German Russian (95.4%, a difference of 0.010%), Burmese (95.4%, a difference of 0.010%), and Immigrants from Bulgaria (95.5%, a difference of 0.020%).
| Demographics | Rating | Rank | 9th Grade |
| Syrians | 97.4 /100 | #104 | Exceptional 95.5% |
| Immigrants | France | 97.4 /100 | #105 | Exceptional 95.5% |
| Immigrants | Norway | 97.1 /100 | #106 | Exceptional 95.5% |
| Immigrants | Zimbabwe | 96.9 /100 | #107 | Exceptional 95.5% |
| Chickasaw | 96.8 /100 | #108 | Exceptional 95.5% |
| Osage | 96.8 /100 | #109 | Exceptional 95.5% |
| Immigrants | Bulgaria | 96.7 /100 | #110 | Exceptional 95.5% |
| Cherokee | 96.3 /100 | #111 | Exceptional 95.4% |
| Immigrants | Croatia | 96.2 /100 | #112 | Exceptional 95.4% |
| Iroquois | 96.2 /100 | #113 | Exceptional 95.4% |
| German Russians | 96.1 /100 | #114 | Exceptional 95.4% |
| Burmese | 96.0 /100 | #115 | Exceptional 95.4% |
| Immigrants | Europe | 95.7 /100 | #116 | Exceptional 95.4% |
| Immigrants | Romania | 95.6 /100 | #117 | Exceptional 95.4% |
| Immigrants | Turkey | 95.6 /100 | #118 | Exceptional 95.4% |
Demographics Similar to Lithuanians by 9th Grade
In terms of 9th grade, the demographic groups most similar to Lithuanians are Finnish (96.6%, a difference of 0.0%), English (96.6%, a difference of 0.020%), Tlingit-Haida (96.6%, a difference of 0.040%), Danish (96.5%, a difference of 0.070%), and Scottish (96.5%, a difference of 0.070%).
| Demographics | Rating | Rank | 9th Grade |
| Slovaks | 100.0 /100 | #3 | Exceptional 96.9% |
| Slovenes | 100.0 /100 | #4 | Exceptional 96.7% |
| Swedes | 100.0 /100 | #5 | Exceptional 96.7% |
| Poles | 100.0 /100 | #6 | Exceptional 96.7% |
| Carpatho Rusyns | 100.0 /100 | #7 | Exceptional 96.7% |
| Germans | 100.0 /100 | #8 | Exceptional 96.7% |
| Tlingit-Haida | 100.0 /100 | #9 | Exceptional 96.6% |
| Lithuanians | 100.0 /100 | #10 | Exceptional 96.6% |
| Finns | 100.0 /100 | #11 | Exceptional 96.6% |
| English | 100.0 /100 | #12 | Exceptional 96.6% |
| Danes | 100.0 /100 | #13 | Exceptional 96.5% |
| Scottish | 100.0 /100 | #14 | Exceptional 96.5% |
| Irish | 100.0 /100 | #15 | Exceptional 96.5% |
| Croatians | 100.0 /100 | #16 | Exceptional 96.5% |
| Dutch | 100.0 /100 | #17 | Exceptional 96.5% |