Bermudan vs Apache 3rd Grade
COMPARE
Bermudan
Apache
3rd Grade
3rd Grade Comparison
Bermudans
Apache
97.8%
3RD GRADE
62.6/ 100
METRIC RATING
155th/ 347
METRIC RANK
97.8%
3RD GRADE
68.5/ 100
METRIC RATING
153rd/ 347
METRIC RANK
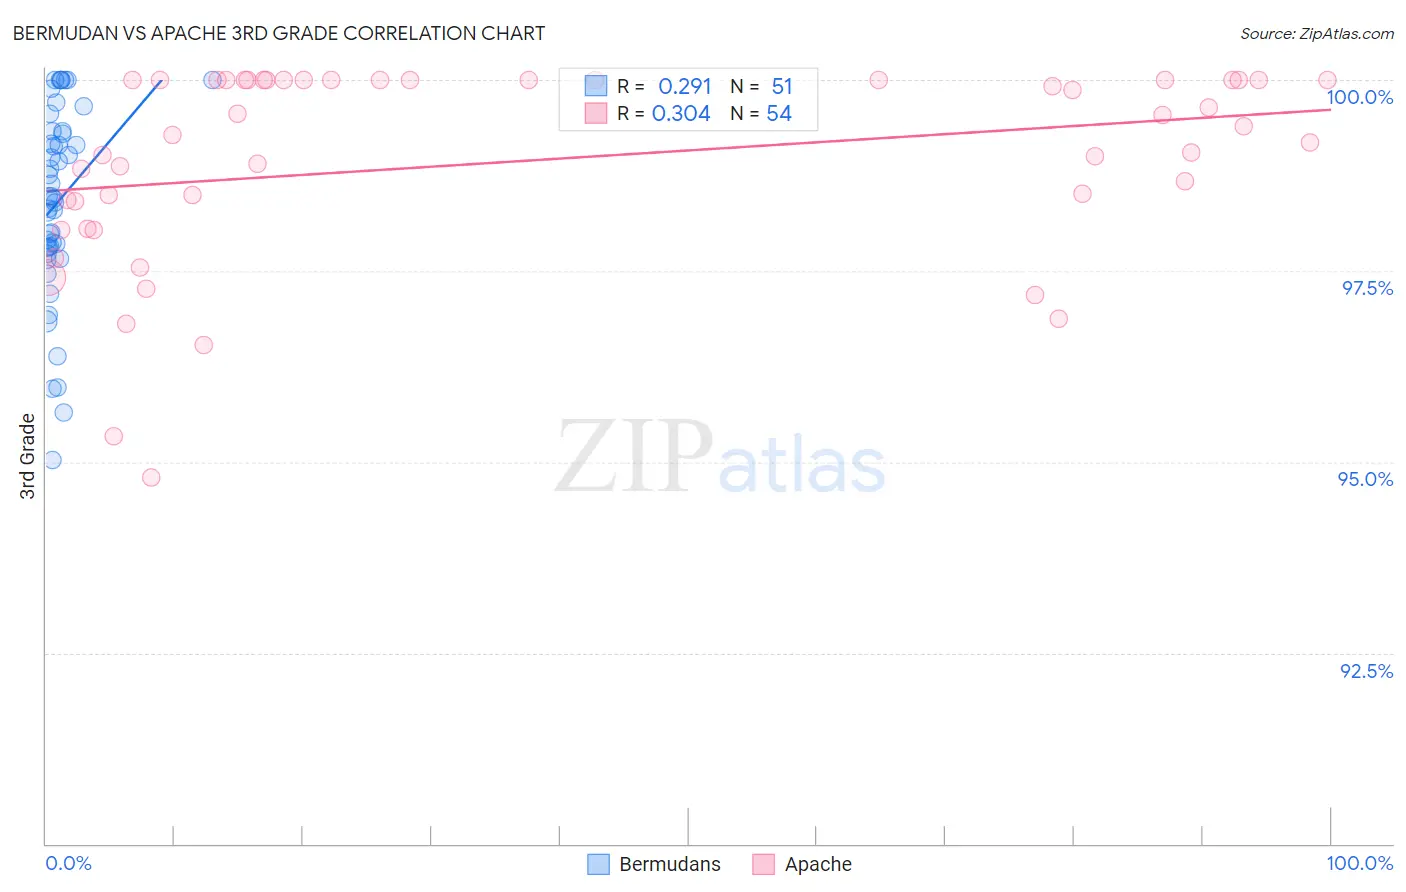
Bermudan vs Apache 3rd Grade Correlation Chart
The statistical analysis conducted on geographies consisting of 55,721,975 people shows a weak positive correlation between the proportion of Bermudans and percentage of population with at least 3rd grade education in the United States with a correlation coefficient (R) of 0.291 and weighted average of 97.8%. Similarly, the statistical analysis conducted on geographies consisting of 231,142,814 people shows a mild positive correlation between the proportion of Apache and percentage of population with at least 3rd grade education in the United States with a correlation coefficient (R) of 0.304 and weighted average of 97.8%, a difference of 0.020%.
3rd Grade Correlation Summary
| Measurement | Bermudan | Apache |
| Minimum | 95.0% | 94.8% |
| Maximum | 100.0% | 100.0% |
| Range | 5.0% | 5.2% |
| Mean | 98.4% | 98.9% |
| Median | 98.5% | 99.3% |
| Interquartile 25% (IQ1) | 97.8% | 98.4% |
| Interquartile 75% (IQ3) | 99.3% | 100.0% |
| Interquartile Range (IQR) | 1.5% | 1.6% |
| Standard Deviation (Sample) | 1.2% | 1.3% |
| Standard Deviation (Population) | 1.2% | 1.3% |
Demographics Similar to Bermudans and Apache by 3rd Grade
In terms of 3rd grade, the demographic groups most similar to Bermudans are Immigrants from Russia (97.8%, a difference of 0.0%), Immigrants from Eastern Europe (97.8%, a difference of 0.010%), Immigrants from Italy (97.8%, a difference of 0.010%), Venezuelan (97.8%, a difference of 0.010%), and French American Indian (97.8%, a difference of 0.010%). Similarly, the demographic groups most similar to Apache are Immigrants from South Central Asia (97.8%, a difference of 0.0%), Jordanian (97.8%, a difference of 0.020%), Soviet Union (97.8%, a difference of 0.020%), Immigrants from Eastern Europe (97.8%, a difference of 0.020%), and Immigrants from North Macedonia (97.8%, a difference of 0.030%).
| Demographics | Rating | Rank | 3rd Grade |
| Burmese | 79.6 /100 | #144 | Good 97.9% |
| Immigrants | Greece | 79.5 /100 | #145 | Good 97.9% |
| Alsatians | 78.3 /100 | #146 | Good 97.9% |
| Immigrants | Israel | 77.3 /100 | #147 | Good 97.9% |
| Immigrants | Moldova | 77.1 /100 | #148 | Good 97.9% |
| Immigrants | North Macedonia | 74.5 /100 | #149 | Good 97.8% |
| Jordanians | 74.5 /100 | #150 | Good 97.8% |
| Soviet Union | 72.6 /100 | #151 | Good 97.8% |
| Immigrants | South Central Asia | 69.5 /100 | #152 | Good 97.8% |
| Apache | 68.5 /100 | #153 | Good 97.8% |
| Immigrants | Eastern Europe | 64.1 /100 | #154 | Good 97.8% |
| Bermudans | 62.6 /100 | #155 | Good 97.8% |
| Immigrants | Russia | 61.7 /100 | #156 | Good 97.8% |
| Immigrants | Italy | 61.2 /100 | #157 | Good 97.8% |
| Venezuelans | 60.9 /100 | #158 | Good 97.8% |
| French American Indians | 60.0 /100 | #159 | Average 97.8% |
| Immigrants | Iran | 59.1 /100 | #160 | Average 97.8% |
| Albanians | 58.8 /100 | #161 | Average 97.8% |
| Immigrants | Jordan | 57.9 /100 | #162 | Average 97.8% |
| Marshallese | 57.2 /100 | #163 | Average 97.8% |
| Immigrants | Bosnia and Herzegovina | 56.2 /100 | #164 | Average 97.8% |