Laotian vs Immigrants from Guyana 10th Grade
COMPARE
Laotian
Immigrants from Guyana
10th Grade
10th Grade Comparison
Laotians
Immigrants from Guyana
93.6%
10TH GRADE
32.1/ 100
METRIC RATING
190th/ 347
METRIC RANK
91.2%
10TH GRADE
0.0/ 100
METRIC RATING
302nd/ 347
METRIC RANK
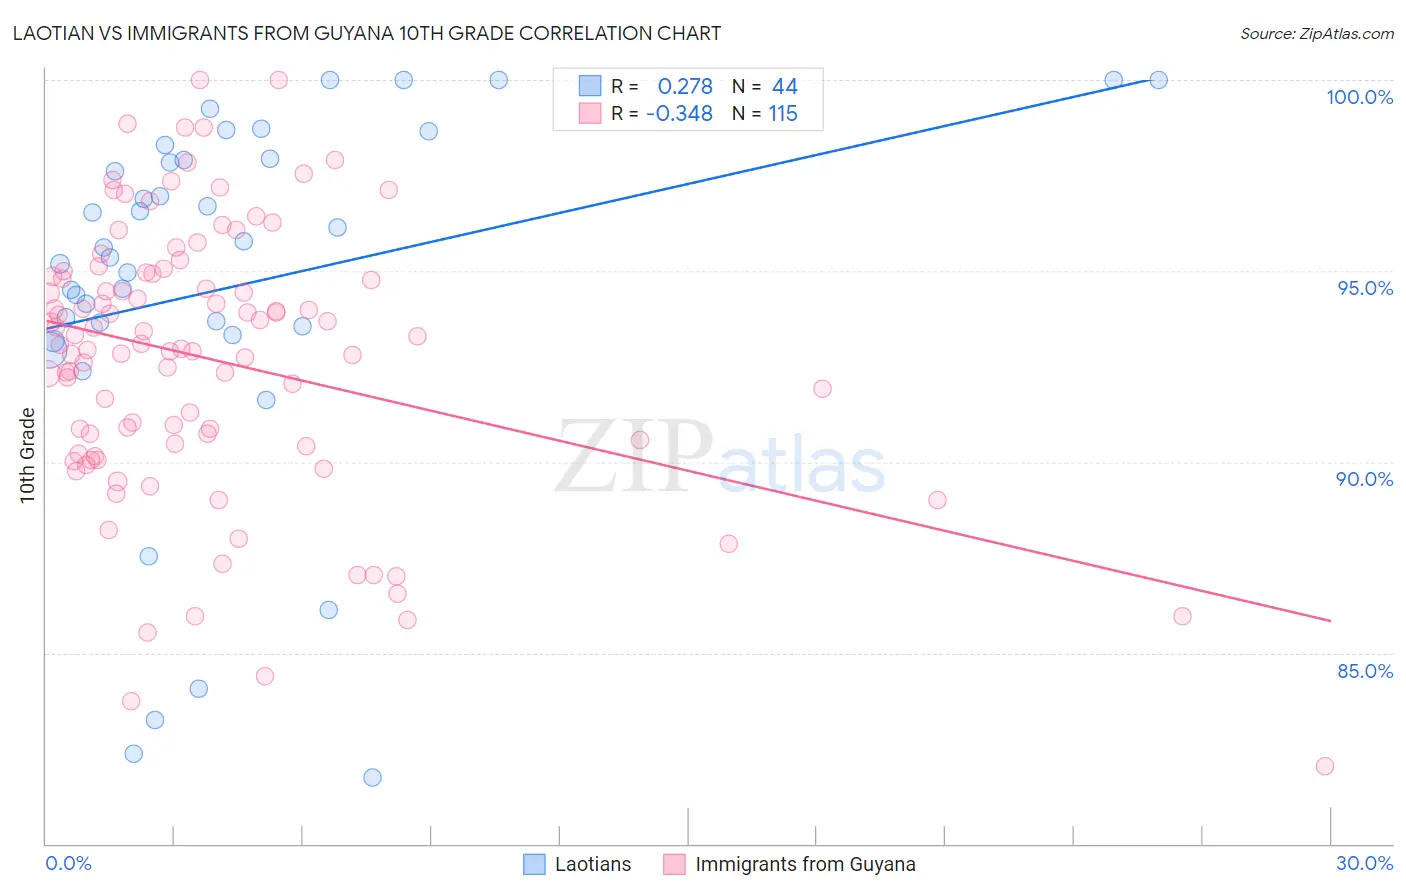
Laotian vs Immigrants from Guyana 10th Grade Correlation Chart
The statistical analysis conducted on geographies consisting of 224,854,130 people shows a weak positive correlation between the proportion of Laotians and percentage of population with at least 10th grade education in the United States with a correlation coefficient (R) of 0.278 and weighted average of 93.6%. Similarly, the statistical analysis conducted on geographies consisting of 183,673,461 people shows a mild negative correlation between the proportion of Immigrants from Guyana and percentage of population with at least 10th grade education in the United States with a correlation coefficient (R) of -0.348 and weighted average of 91.2%, a difference of 2.6%.
10th Grade Correlation Summary
| Measurement | Laotian | Immigrants from Guyana |
| Minimum | 81.7% | 82.0% |
| Maximum | 100.0% | 100.0% |
| Range | 18.3% | 18.0% |
| Mean | 94.6% | 92.7% |
| Median | 95.5% | 93.1% |
| Interquartile 25% (IQ1) | 93.4% | 90.4% |
| Interquartile 75% (IQ3) | 97.9% | 94.9% |
| Interquartile Range (IQR) | 4.5% | 4.5% |
| Standard Deviation (Sample) | 4.8% | 3.6% |
| Standard Deviation (Population) | 4.8% | 3.6% |
Similar Demographics by 10th Grade
Demographics Similar to Laotians by 10th Grade
In terms of 10th grade, the demographic groups most similar to Laotians are Immigrants from Pakistan (93.6%, a difference of 0.0%), Marshallese (93.6%, a difference of 0.010%), Yup'ik (93.6%, a difference of 0.010%), Immigrants from Eastern Asia (93.6%, a difference of 0.030%), and Liberian (93.6%, a difference of 0.030%).
| Demographics | Rating | Rank | 10th Grade |
| Guamanians/Chamorros | 37.1 /100 | #183 | Fair 93.6% |
| Choctaw | 36.6 /100 | #184 | Fair 93.6% |
| Sudanese | 36.6 /100 | #185 | Fair 93.6% |
| Immigrants | Eastern Asia | 35.1 /100 | #186 | Fair 93.6% |
| Liberians | 34.7 /100 | #187 | Fair 93.6% |
| Marshallese | 33.2 /100 | #188 | Fair 93.6% |
| Immigrants | Pakistan | 32.5 /100 | #189 | Fair 93.6% |
| Laotians | 32.1 /100 | #190 | Fair 93.6% |
| Yup'ik | 31.1 /100 | #191 | Fair 93.6% |
| Immigrants | Malaysia | 28.0 /100 | #192 | Fair 93.5% |
| Panamanians | 28.0 /100 | #193 | Fair 93.5% |
| Immigrants | Morocco | 26.9 /100 | #194 | Fair 93.5% |
| Cheyenne | 26.8 /100 | #195 | Fair 93.5% |
| Moroccans | 25.3 /100 | #196 | Fair 93.5% |
| Pueblo | 23.9 /100 | #197 | Fair 93.5% |
Demographics Similar to Immigrants from Guyana by 10th Grade
In terms of 10th grade, the demographic groups most similar to Immigrants from Guyana are Japanese (91.2%, a difference of 0.010%), Immigrants from Vietnam (91.2%, a difference of 0.020%), Pima (91.2%, a difference of 0.080%), Immigrants from Dominica (91.1%, a difference of 0.090%), and Yaqui (91.1%, a difference of 0.15%).
| Demographics | Rating | Rank | 10th Grade |
| Lumbee | 0.0 /100 | #295 | Tragic 91.7% |
| Immigrants | Grenada | 0.0 /100 | #296 | Tragic 91.6% |
| Fijians | 0.0 /100 | #297 | Tragic 91.5% |
| Cubans | 0.0 /100 | #298 | Tragic 91.5% |
| Immigrants | Haiti | 0.0 /100 | #299 | Tragic 91.4% |
| Guyanese | 0.0 /100 | #300 | Tragic 91.4% |
| Japanese | 0.0 /100 | #301 | Tragic 91.2% |
| Immigrants | Guyana | 0.0 /100 | #302 | Tragic 91.2% |
| Immigrants | Vietnam | 0.0 /100 | #303 | Tragic 91.2% |
| Pima | 0.0 /100 | #304 | Tragic 91.2% |
| Immigrants | Dominica | 0.0 /100 | #305 | Tragic 91.1% |
| Yaqui | 0.0 /100 | #306 | Tragic 91.1% |
| Immigrants | Fiji | 0.0 /100 | #307 | Tragic 91.0% |
| Immigrants | Bangladesh | 0.0 /100 | #308 | Tragic 91.0% |
| Immigrants | Immigrants | 0.0 /100 | #309 | Tragic 91.0% |