English vs Alsatian 11th Grade
COMPARE
English
Alsatian
11th Grade
11th Grade Comparison
English
Alsatians
94.4%
11TH GRADE
100.0/ 100
METRIC RATING
24th/ 347
METRIC RANK
92.6%
11TH GRADE
60.2/ 100
METRIC RATING
167th/ 347
METRIC RANK
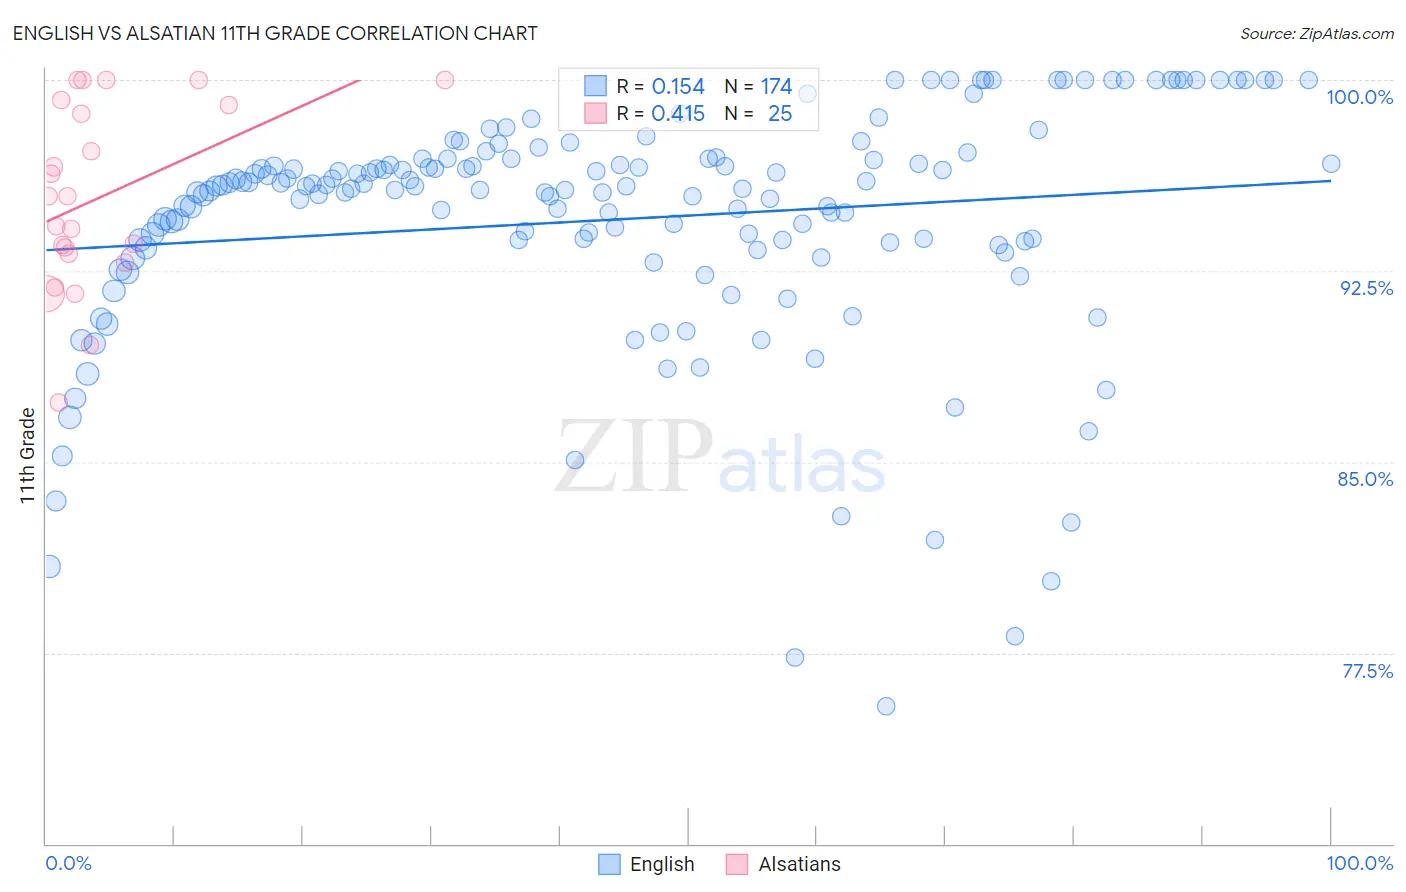
English vs Alsatian 11th Grade Correlation Chart
The statistical analysis conducted on geographies consisting of 579,980,001 people shows a poor positive correlation between the proportion of English and percentage of population with at least 11th grade education in the United States with a correlation coefficient (R) of 0.154 and weighted average of 94.4%. Similarly, the statistical analysis conducted on geographies consisting of 82,682,365 people shows a moderate positive correlation between the proportion of Alsatians and percentage of population with at least 11th grade education in the United States with a correlation coefficient (R) of 0.415 and weighted average of 92.6%, a difference of 1.9%.
11th Grade Correlation Summary
| Measurement | English | Alsatian |
| Minimum | 75.4% | 87.3% |
| Maximum | 100.0% | 100.0% |
| Range | 24.6% | 12.7% |
| Mean | 94.5% | 95.4% |
| Median | 95.7% | 95.4% |
| Interquartile 25% (IQ1) | 93.5% | 93.0% |
| Interquartile 75% (IQ3) | 96.9% | 99.1% |
| Interquartile Range (IQR) | 3.4% | 6.1% |
| Standard Deviation (Sample) | 4.7% | 3.6% |
| Standard Deviation (Population) | 4.7% | 3.6% |
Similar Demographics by 11th Grade
Demographics Similar to English by 11th Grade
In terms of 11th grade, the demographic groups most similar to English are Irish (94.4%, a difference of 0.020%), Scottish (94.4%, a difference of 0.020%), Tsimshian (94.4%, a difference of 0.030%), Czech (94.4%, a difference of 0.030%), and Tlingit-Haida (94.4%, a difference of 0.040%).
| Demographics | Rating | Rank | 11th Grade |
| Luxembourgers | 100.0 /100 | #17 | Exceptional 94.5% |
| Maltese | 100.0 /100 | #18 | Exceptional 94.5% |
| Scandinavians | 100.0 /100 | #19 | Exceptional 94.5% |
| Italians | 100.0 /100 | #20 | Exceptional 94.5% |
| Tlingit-Haida | 100.0 /100 | #21 | Exceptional 94.4% |
| Tsimshian | 100.0 /100 | #22 | Exceptional 94.4% |
| Czechs | 100.0 /100 | #23 | Exceptional 94.4% |
| English | 100.0 /100 | #24 | Exceptional 94.4% |
| Irish | 100.0 /100 | #25 | Exceptional 94.4% |
| Scottish | 100.0 /100 | #26 | Exceptional 94.4% |
| Europeans | 100.0 /100 | #27 | Exceptional 94.4% |
| Estonians | 100.0 /100 | #28 | Exceptional 94.4% |
| Dutch | 100.0 /100 | #29 | Exceptional 94.3% |
| Russians | 100.0 /100 | #30 | Exceptional 94.3% |
| Welsh | 99.9 /100 | #31 | Exceptional 94.2% |
Demographics Similar to Alsatians by 11th Grade
In terms of 11th grade, the demographic groups most similar to Alsatians are Bermudan (92.6%, a difference of 0.020%), Sierra Leonean (92.6%, a difference of 0.020%), Immigrants from Albania (92.6%, a difference of 0.020%), Immigrants from Northern Africa (92.6%, a difference of 0.030%), and Immigrants from Iraq (92.6%, a difference of 0.040%).
| Demographics | Rating | Rank | 11th Grade |
| Immigrants | Lebanon | 70.7 /100 | #160 | Good 92.7% |
| Immigrants | Argentina | 69.8 /100 | #161 | Good 92.7% |
| Paraguayans | 68.7 /100 | #162 | Good 92.7% |
| Immigrants | Nonimmigrants | 66.6 /100 | #163 | Good 92.7% |
| Spanish | 66.2 /100 | #164 | Good 92.7% |
| Immigrants | Iraq | 63.7 /100 | #165 | Good 92.6% |
| Bermudans | 62.3 /100 | #166 | Good 92.6% |
| Alsatians | 60.2 /100 | #167 | Good 92.6% |
| Sierra Leoneans | 58.7 /100 | #168 | Average 92.6% |
| Immigrants | Albania | 57.8 /100 | #169 | Average 92.6% |
| Immigrants | Northern Africa | 57.3 /100 | #170 | Average 92.6% |
| Laotians | 54.4 /100 | #171 | Average 92.6% |
| Immigrants | Pakistan | 52.3 /100 | #172 | Average 92.5% |
| Indians (Asian) | 51.5 /100 | #173 | Average 92.5% |
| Asians | 50.0 /100 | #174 | Average 92.5% |