English vs Immigrants from Indonesia Doctorate Degree

COMPARE

English
Race
Ancestry
AfghanAfricanAlaska NativeAlaskan AthabascanAlbanianAleutAlsatianAmericanApacheArabArapahoArgentineanArmenianAssyrian/Chaldean/SyriacAustralianAustrianBahamianBangladeshiBarbadianBasqueBelgianBelizeanBermudanBhutaneseBlackfeetBolivianBrazilianBritishBritish West IndianBulgarianBurmeseCajunCambodianCanadianCape VerdeanCarpatho RusynCelticCentral AmericanCentral American IndianCherokeeCheyenneChickasawChileanChineseChippewaChoctawColombianColvilleComancheCosta RicanCreeCreekCroatianCrowCubanCypriotCzechCzechoslovakianDanishDelawareDominicanDutchDutch West IndianEastern EuropeanEcuadorianEgyptianEnglishEstonianEthiopianEuropeanFijianFilipinoFinnishFrenchFrench American IndianFrench CanadianGermanGerman RussianGhanaianGreekGuamanian/ChamorroGuatemalanGuyaneseHaitianHmongHonduranHopiHoumaHungarianIcelanderIndian (Asian)IndonesianInupiatIranianIraqiIrishIroquoisIsraeliItalianJamaicanJapaneseJordanianKenyanKiowaKoreanLaotianLatvianLebaneseLiberianLithuanianLumbeeLuxembourgerMacedonianMalaysianMalteseMarshalleseMenomineeMexicanMexican American IndianMongolianMoroccanNative HawaiianNavajoNepaleseNew ZealanderNicaraguanNigerianNorthern EuropeanNorwegianOkinawanOsageOttawaPaiutePakistaniPalestinianPanamanianParaguayanPennsylvania GermanPeruvianPimaPolishPortuguesePotawatomiPuebloPuerto RicanPuget Sound SalishRomanianRussianSalvadoranSamoanScandinavianScotch-IrishScottishSeminoleSenegaleseSerbianShoshoneSierra LeoneanSiouxSlavicSlovakSloveneSomaliSouth AfricanSouth AmericanSouth American IndianSoviet UnionSpaniardSpanishSpanish AmericanSpanish American IndianSri LankanSubsaharan AfricanSudaneseSwedishSwissSyrianTaiwaneseThaiTlingit-HaidaTohono O'OdhamTonganTrinidadian and TobagonianTsimshianTurkishU.S. Virgin IslanderUgandanUkrainianUruguayanUteVenezuelanVietnameseWelshWest IndianYakamaYaquiYugoslavianYumanYup'ikZimbabwean
Immigration
NonimmigrantsImmigrantsAfghanistanAfricaAlbaniaArgentinaArmeniaAsiaAustraliaAustriaBahamasBangladeshBarbadosBelarusBelgiumBelizeBoliviaBosnia and HerzegovinaBrazilBulgariaBurma/MyanmarCabo VerdeCambodiaCameroonCanadaCaribbeanCentral AmericaChileChinaColombiaCongoCosta RicaCroatiaCubaCzechoslovakiaDenmarkDominicaDominican RepublicEastern AfricaEastern AsiaEastern EuropeEcuadorEgyptEl SalvadorEnglandEritreaEthiopiaEuropeFijiFranceGermanyGhanaGreeceGrenadaGuatemalaGuyanaHaitiHondurasHong KongHungaryIndiaIranIraqIrelandIsraelItalyJamaicaJapanJordanKazakhstanKenyaKoreaKuwaitLaosLatin AmericaLatviaLebanonLiberiaLithuaniaMalaysiaMexicoMicronesiaMiddle AfricaMoldovaMoroccoNepalNetherlandsNicaraguaNigeriaNorth AmericaNorth MacedoniaNorthern AfricaNorthern EuropeNorwayOceaniaPakistanPanamaPeruPhilippinesPolandPortugalRomaniaRussiaSaudi ArabiaScotlandSenegalSerbiaSierra LeoneSingaporeSomaliaSouth AfricaSouth AmericaSouth Central AsiaSouth Eastern AsiaSouthern EuropeSpainSri LankaSt. Vincent and the GrenadinesSudanSwedenSwitzerlandSyriaTaiwanThailandTrinidad and TobagoTurkeyUgandaUkraineUruguayUzbekistanVenezuelaVietnamWest IndiesWestern AfricaWestern AsiaWestern EuropeYemenZaireZimbabweAzores
Immigrants from Indonesia
Race
Ancestry
AfghanAfricanAlaska NativeAlaskan AthabascanAlbanianAleutAlsatianAmericanApacheArabArapahoArgentineanArmenianAssyrian/Chaldean/SyriacAustralianAustrianBahamianBangladeshiBarbadianBasqueBelgianBelizeanBermudanBhutaneseBlackfeetBolivianBrazilianBritishBritish West IndianBulgarianBurmeseCajunCambodianCanadianCape VerdeanCarpatho RusynCelticCentral AmericanCentral American IndianCherokeeCheyenneChickasawChileanChineseChippewaChoctawColombianColvilleComancheCosta RicanCreeCreekCroatianCrowCubanCypriotCzechCzechoslovakianDanishDelawareDominicanDutchDutch West IndianEastern EuropeanEcuadorianEgyptianEstonianEthiopianEuropeanFijianFilipinoFinnishFrenchFrench American IndianFrench CanadianGermanGerman RussianGhanaianGreekGuamanian/ChamorroGuatemalanGuyaneseHaitianHmongHonduranHopiHoumaHungarianIcelanderIndian (Asian)IndonesianInupiatIranianIraqiIrishIroquoisIsraeliItalianJamaicanJapaneseJordanianKenyanKiowaKoreanLaotianLatvianLebaneseLiberianLithuanianLumbeeLuxembourgerMacedonianMalaysianMalteseMarshalleseMenomineeMexicanMexican American IndianMongolianMoroccanNative HawaiianNavajoNepaleseNew ZealanderNicaraguanNigerianNorthern EuropeanNorwegianOkinawanOsageOttawaPaiutePakistaniPalestinianPanamanianParaguayanPennsylvania GermanPeruvianPimaPolishPortuguesePotawatomiPuebloPuerto RicanPuget Sound SalishRomanianRussianSalvadoranSamoanScandinavianScotch-IrishScottishSeminoleSenegaleseSerbianShoshoneSierra LeoneanSiouxSlavicSlovakSloveneSomaliSouth AfricanSouth AmericanSouth American IndianSoviet UnionSpaniardSpanishSpanish AmericanSpanish American IndianSri LankanSubsaharan AfricanSudaneseSwedishSwissSyrianTaiwaneseThaiTlingit-HaidaTohono O'OdhamTonganTrinidadian and TobagonianTsimshianTurkishU.S. Virgin IslanderUgandanUkrainianUruguayanUteVenezuelanVietnameseWelshWest IndianYakamaYaquiYugoslavianYumanYup'ikZimbabwean
Immigration
NonimmigrantsImmigrantsAfghanistanAfricaAlbaniaArgentinaArmeniaAsiaAustraliaAustriaBahamasBangladeshBarbadosBelarusBelgiumBelizeBoliviaBosnia and HerzegovinaBrazilBulgariaBurma/MyanmarCabo VerdeCambodiaCameroonCanadaCaribbeanCentral AmericaChileChinaColombiaCongoCosta RicaCroatiaCubaCzechoslovakiaDenmarkDominicaDominican RepublicEastern AfricaEastern AsiaEastern EuropeEcuadorEgyptEl SalvadorEnglandEritreaEthiopiaEuropeFijiFranceGermanyGhanaGreeceGrenadaGuatemalaGuyanaHaitiHondurasHong KongHungaryIndiaIndonesiaIranIraqIrelandIsraelItalyJamaicaJapanJordanKazakhstanKenyaKoreaKuwaitLaosLatin AmericaLatviaLebanonLiberiaLithuaniaMalaysiaMexicoMicronesiaMiddle AfricaMoldovaMoroccoNepalNetherlandsNicaraguaNigeriaNorth AmericaNorth MacedoniaNorthern AfricaNorthern EuropeNorwayOceaniaPakistanPanamaPeruPhilippinesPolandPortugalRomaniaRussiaSaudi ArabiaScotlandSenegalSerbiaSierra LeoneSingaporeSomaliaSouth AfricaSouth AmericaSouth Central AsiaSouth Eastern AsiaSouthern EuropeSpainSri LankaSt. Vincent and the GrenadinesSudanSwedenSwitzerlandSyriaTaiwanThailandTrinidad and TobagoTurkeyUgandaUkraineUruguayUzbekistanVenezuelaVietnamWest IndiesWestern AfricaWestern AsiaWestern EuropeYemenZaireZimbabweAzores
Doctorate Degree
Income
Poverty
Unemployment
Labor Participation
Family Structure
Vehicle Availability
Education Level
Disability

Doctorate Degree Comparison

English

Immigrants from Indonesia

Good
Exceptional
1.9%
DOCTORATE DEGREE
75.9/ 100
METRIC RATING
150th/ 347
METRIC RANK
2.4%
DOCTORATE DEGREE
100.0/ 100
METRIC RATING
54th/ 347
METRIC RANK

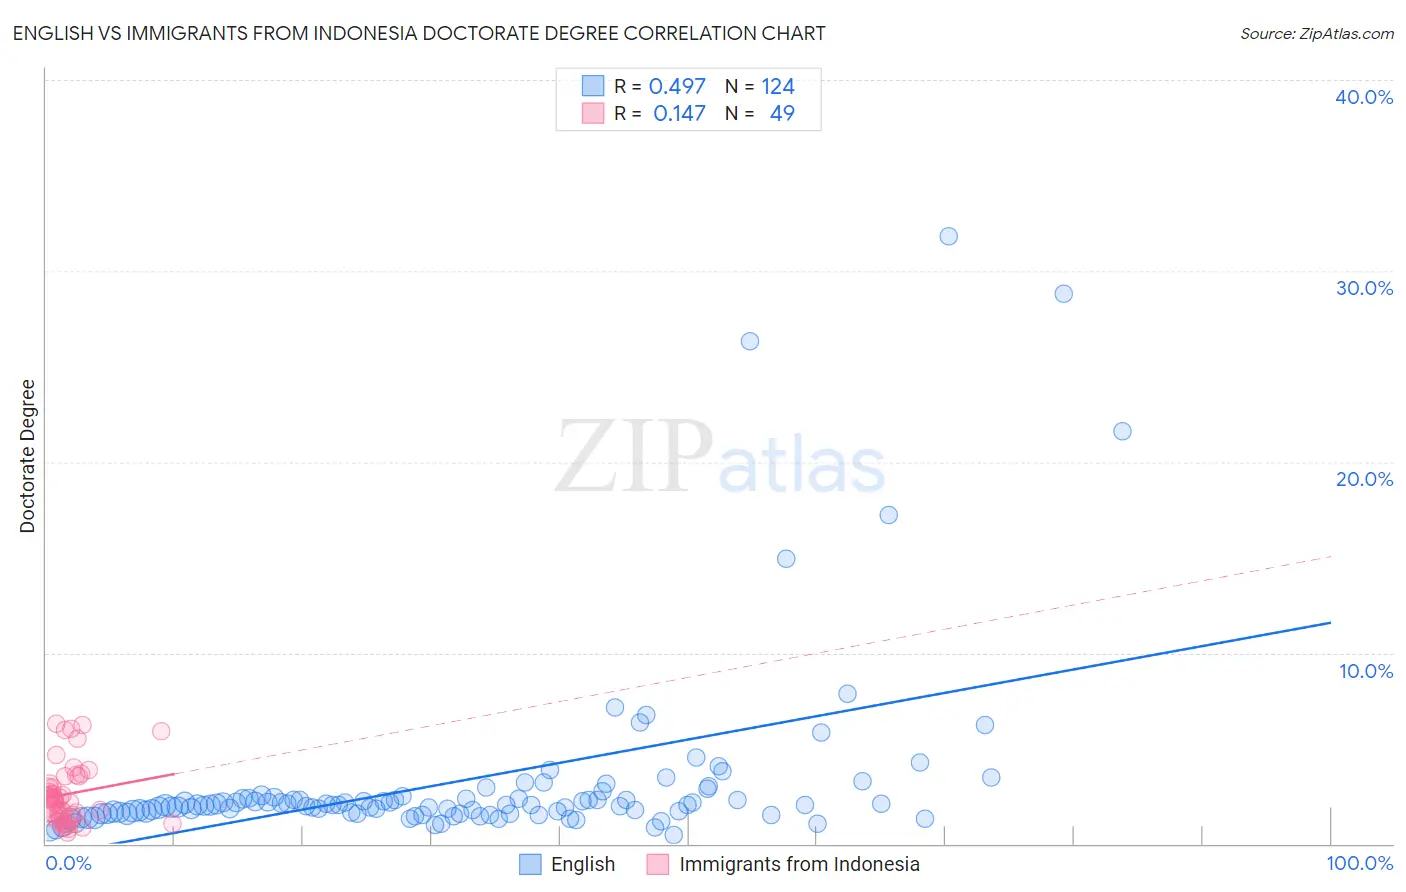
English vs Immigrants from Indonesia Doctorate Degree Correlation Chart

The statistical analysis conducted on geographies consisting of 550,351,908 people shows a moderate positive correlation between the proportion of English and percentage of population with at least doctorate degree education in the United States with a correlation coefficient (R) of 0.497 and weighted average of 1.9%. Similarly, the statistical analysis conducted on geographies consisting of 215,315,104 people shows a poor positive correlation between the proportion of Immigrants from Indonesia and percentage of population with at least doctorate degree education in the United States with a correlation coefficient (R) of 0.147 and weighted average of 2.4%, a difference of 23.5%.
English vs Immigrants from Indonesia Doctorate Degree

Doctorate Degree Correlation Summary

MeasurementEnglishImmigrants from Indonesia
Minimum0.49%0.57%
Maximum31.8%6.3%
Range31.3%5.7%
Mean3.3%2.6%
Median2.0%2.3%
Interquartile 25% (IQ1)1.6%1.4%
Interquartile 75% (IQ3)2.4%3.5%
Interquartile Range (IQR)0.77%2.1%
Standard Deviation (Sample)4.9%1.6%
Standard Deviation (Population)4.9%1.6%

Similar Demographics by Doctorate Degree

Demographics Similar to English by Doctorate Degree

In terms of doctorate degree, the demographic groups most similar to English are Albanian (1.9%, a difference of 0.19%), Basque (1.9%, a difference of 0.20%), Immigrants from Kenya (1.9%, a difference of 0.30%), Immigrants from Oceania (1.9%, a difference of 0.34%), and Immigrants from Albania (1.9%, a difference of 0.57%).
DemographicsRating | RankDoctorate Degree
Sierra Leoneans
85.1
/100
|
#143
Excellent
2.0%
Immigrants | Moldova
84.3
/100
|
#144
Excellent
2.0%
Kenyans
83.6
/100
|
#145
Excellent
1.9%
Immigrants | Syria
83.6
/100
|
#146
Excellent
1.9%
Immigrants | Senegal
82.5
/100
|
#147
Excellent
1.9%
Luxembourgers
81.1
/100
|
#148
Excellent
1.9%
Basques
76.9
/100
|
#149
Good
1.9%
English
75.9
/100
|
#150
Good
1.9%
Albanians
74.8
/100
|
#151
Good
1.9%
Immigrants | Kenya
74.3
/100
|
#152
Good
1.9%
Immigrants | Oceania
74.0
/100
|
#153
Good
1.9%
Immigrants | Albania
72.8
/100
|
#154
Good
1.9%
Poles
72.7
/100
|
#155
Good
1.9%
Slavs
72.4
/100
|
#156
Good
1.9%
Danes
71.9
/100
|
#157
Good
1.9%

Demographics Similar to Immigrants from Indonesia by Doctorate Degree

In terms of doctorate degree, the demographic groups most similar to Immigrants from Indonesia are Bolivian (2.4%, a difference of 0.080%), Immigrants from Czechoslovakia (2.4%, a difference of 0.17%), Immigrants from Ethiopia (2.4%, a difference of 0.61%), Immigrants from Latvia (2.4%, a difference of 0.68%), and Ethiopian (2.3%, a difference of 0.73%).
DemographicsRating | RankDoctorate Degree
Immigrants | Western Europe
100.0
/100
|
#47
Exceptional
2.4%
Asians
100.0
/100
|
#48
Exceptional
2.4%
Immigrants | Asia
100.0
/100
|
#49
Exceptional
2.4%
Immigrants | Norway
100.0
/100
|
#50
Exceptional
2.4%
Australians
100.0
/100
|
#51
Exceptional
2.4%
Bulgarians
100.0
/100
|
#52
Exceptional
2.4%
Immigrants | Latvia
100.0
/100
|
#53
Exceptional
2.4%
Immigrants | Indonesia
100.0
/100
|
#54
Exceptional
2.4%
Bolivians
100.0
/100
|
#55
Exceptional
2.4%
Immigrants | Czechoslovakia
100.0
/100
|
#56
Exceptional
2.4%
Immigrants | Ethiopia
100.0
/100
|
#57
Exceptional
2.4%
Ethiopians
99.9
/100
|
#58
Exceptional
2.3%
South Africans
99.9
/100
|
#59
Exceptional
2.3%
Immigrants | Serbia
99.9
/100
|
#60
Exceptional
2.3%
Bhutanese
99.9
/100
|
#61
Exceptional
2.3%