Ecuadorian vs Australian 2nd Grade
COMPARE
Ecuadorian
Australian
2nd Grade
2nd Grade Comparison
Ecuadorians
Australians
96.9%
2ND GRADE
0.0/ 100
METRIC RATING
303rd/ 347
METRIC RANK
98.4%
2ND GRADE
99.8/ 100
METRIC RATING
52nd/ 347
METRIC RANK
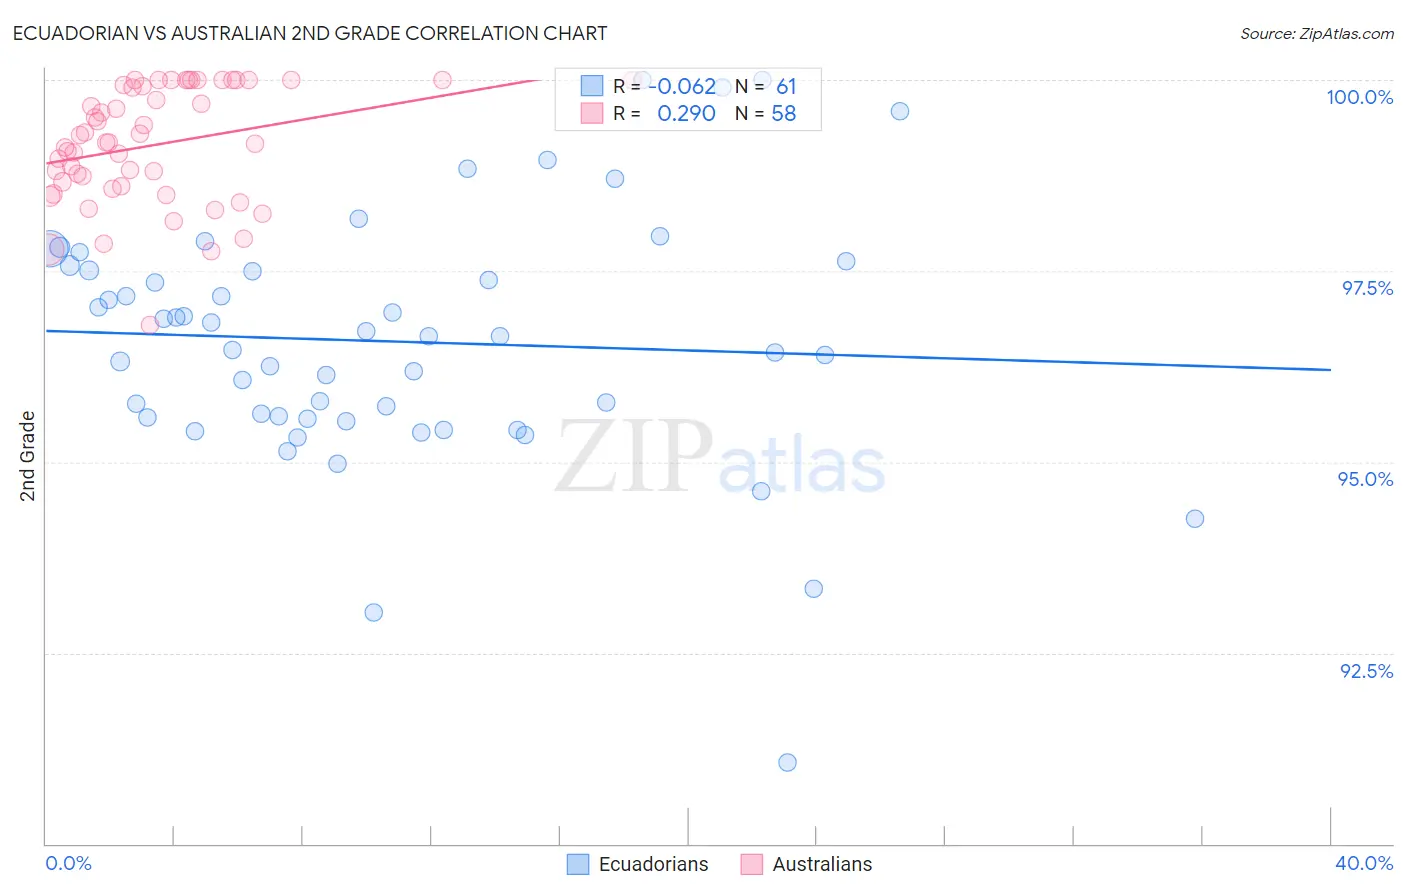
Ecuadorian vs Australian 2nd Grade Correlation Chart
The statistical analysis conducted on geographies consisting of 317,865,723 people shows a slight negative correlation between the proportion of Ecuadorians and percentage of population with at least 2nd grade education in the United States with a correlation coefficient (R) of -0.062 and weighted average of 96.9%. Similarly, the statistical analysis conducted on geographies consisting of 224,153,392 people shows a weak positive correlation between the proportion of Australians and percentage of population with at least 2nd grade education in the United States with a correlation coefficient (R) of 0.290 and weighted average of 98.4%, a difference of 1.5%.
2nd Grade Correlation Summary
| Measurement | Ecuadorian | Australian |
| Minimum | 91.1% | 96.8% |
| Maximum | 100.0% | 100.0% |
| Range | 8.9% | 3.2% |
| Mean | 96.6% | 99.2% |
| Median | 96.6% | 99.2% |
| Interquartile 25% (IQ1) | 95.6% | 98.6% |
| Interquartile 75% (IQ3) | 97.5% | 99.9% |
| Interquartile Range (IQR) | 2.0% | 1.3% |
| Standard Deviation (Sample) | 1.6% | 0.76% |
| Standard Deviation (Population) | 1.6% | 0.75% |
Similar Demographics by 2nd Grade
Demographics Similar to Ecuadorians by 2nd Grade
In terms of 2nd grade, the demographic groups most similar to Ecuadorians are Immigrants from Caribbean (96.9%, a difference of 0.0%), Nicaraguan (96.9%, a difference of 0.020%), Somali (97.0%, a difference of 0.040%), Immigrants from Somalia (96.9%, a difference of 0.040%), and Central American Indian (97.0%, a difference of 0.060%).
| Demographics | Rating | Rank | 2nd Grade |
| Immigrants | Immigrants | 0.0 /100 | #296 | Tragic 97.1% |
| Immigrants | Cuba | 0.0 /100 | #297 | Tragic 97.0% |
| Immigrants | Dominica | 0.0 /100 | #298 | Tragic 97.0% |
| Haitians | 0.0 /100 | #299 | Tragic 97.0% |
| Immigrants | South Eastern Asia | 0.0 /100 | #300 | Tragic 97.0% |
| Central American Indians | 0.0 /100 | #301 | Tragic 97.0% |
| Somalis | 0.0 /100 | #302 | Tragic 97.0% |
| Ecuadorians | 0.0 /100 | #303 | Tragic 96.9% |
| Immigrants | Caribbean | 0.0 /100 | #304 | Tragic 96.9% |
| Nicaraguans | 0.0 /100 | #305 | Tragic 96.9% |
| Immigrants | Somalia | 0.0 /100 | #306 | Tragic 96.9% |
| Immigrants | Azores | 0.0 /100 | #307 | Tragic 96.8% |
| Immigrants | Haiti | 0.0 /100 | #308 | Tragic 96.8% |
| Belizeans | 0.0 /100 | #309 | Tragic 96.8% |
| Sri Lankans | 0.0 /100 | #310 | Tragic 96.8% |
Demographics Similar to Australians by 2nd Grade
In terms of 2nd grade, the demographic groups most similar to Australians are Celtic (98.4%, a difference of 0.0%), White/Caucasian (98.4%, a difference of 0.0%), Estonian (98.4%, a difference of 0.0%), Pueblo (98.3%, a difference of 0.010%), and Kiowa (98.3%, a difference of 0.010%).
| Demographics | Rating | Rank | 2nd Grade |
| Hungarians | 99.9 /100 | #45 | Exceptional 98.4% |
| Lumbee | 99.9 /100 | #46 | Exceptional 98.4% |
| Ottawa | 99.9 /100 | #47 | Exceptional 98.4% |
| Czechoslovakians | 99.9 /100 | #48 | Exceptional 98.4% |
| Celtics | 99.8 /100 | #49 | Exceptional 98.4% |
| Whites/Caucasians | 99.8 /100 | #50 | Exceptional 98.4% |
| Estonians | 99.8 /100 | #51 | Exceptional 98.4% |
| Australians | 99.8 /100 | #52 | Exceptional 98.4% |
| Pueblo | 99.8 /100 | #53 | Exceptional 98.3% |
| Kiowa | 99.8 /100 | #54 | Exceptional 98.3% |
| Immigrants | Scotland | 99.8 /100 | #55 | Exceptional 98.3% |
| Americans | 99.8 /100 | #56 | Exceptional 98.3% |
| Austrians | 99.8 /100 | #57 | Exceptional 98.3% |
| Bulgarians | 99.8 /100 | #58 | Exceptional 98.3% |
| Slavs | 99.8 /100 | #59 | Exceptional 98.3% |