Ecuadorian vs Immigrants from South America 2nd Grade
COMPARE
Ecuadorian
Immigrants from South America
2nd Grade
2nd Grade Comparison
Ecuadorians
Immigrants from South America
96.9%
2ND GRADE
0.0/ 100
METRIC RATING
303rd/ 347
METRIC RANK
97.4%
2ND GRADE
0.4/ 100
METRIC RATING
265th/ 347
METRIC RANK
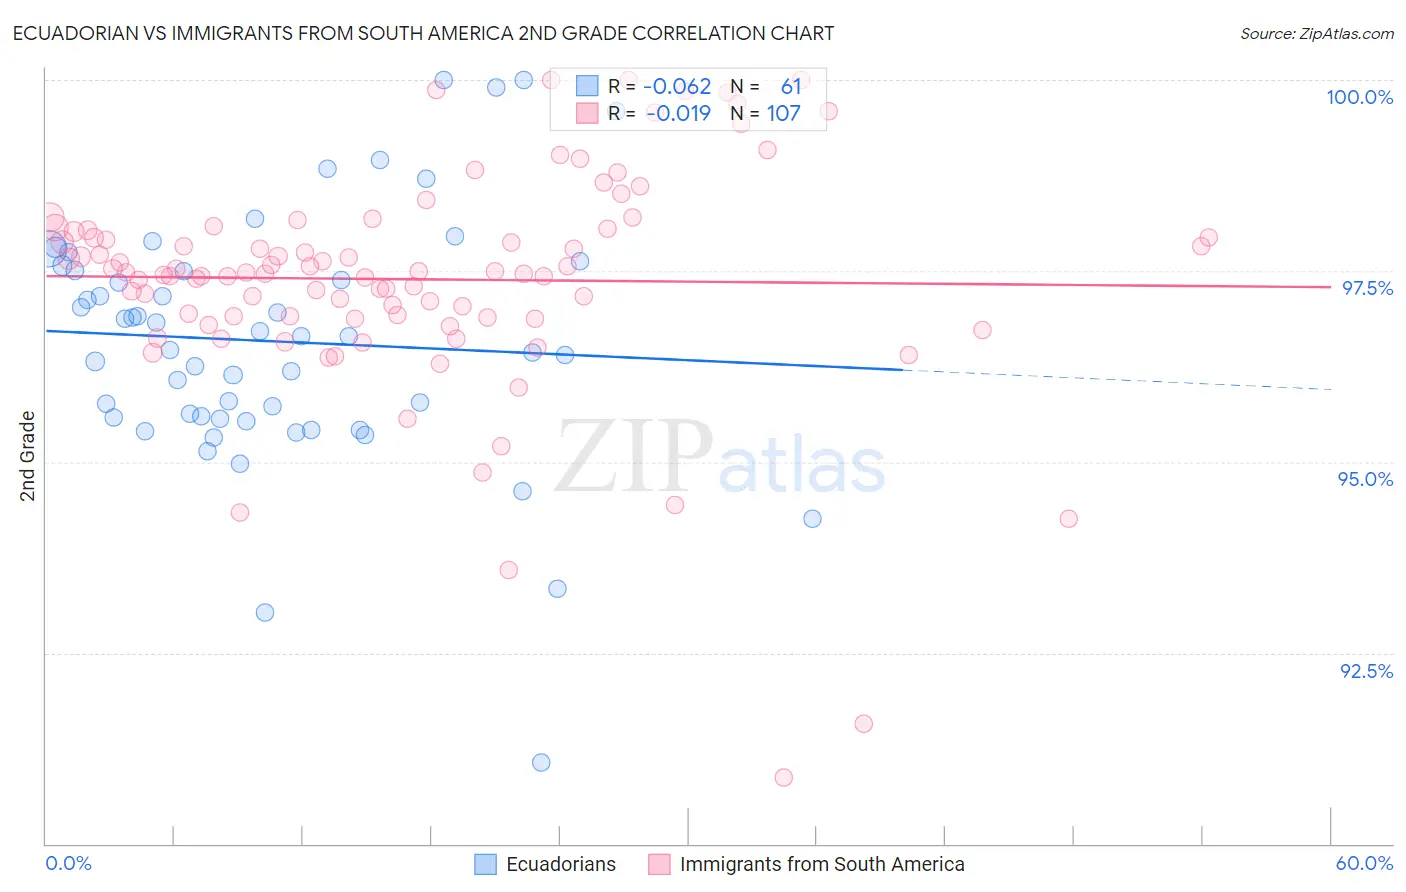
Ecuadorian vs Immigrants from South America 2nd Grade Correlation Chart
The statistical analysis conducted on geographies consisting of 317,865,723 people shows a slight negative correlation between the proportion of Ecuadorians and percentage of population with at least 2nd grade education in the United States with a correlation coefficient (R) of -0.062 and weighted average of 96.9%. Similarly, the statistical analysis conducted on geographies consisting of 486,429,719 people shows no correlation between the proportion of Immigrants from South America and percentage of population with at least 2nd grade education in the United States with a correlation coefficient (R) of -0.019 and weighted average of 97.4%, a difference of 0.54%.
2nd Grade Correlation Summary
| Measurement | Ecuadorian | Immigrants from South America |
| Minimum | 91.1% | 90.9% |
| Maximum | 100.0% | 100.0% |
| Range | 8.9% | 9.1% |
| Mean | 96.6% | 97.4% |
| Median | 96.6% | 97.5% |
| Interquartile 25% (IQ1) | 95.6% | 96.9% |
| Interquartile 75% (IQ3) | 97.5% | 98.0% |
| Interquartile Range (IQR) | 2.0% | 1.1% |
| Standard Deviation (Sample) | 1.6% | 1.5% |
| Standard Deviation (Population) | 1.6% | 1.5% |
Similar Demographics by 2nd Grade
Demographics Similar to Ecuadorians by 2nd Grade
In terms of 2nd grade, the demographic groups most similar to Ecuadorians are Immigrants from Caribbean (96.9%, a difference of 0.0%), Nicaraguan (96.9%, a difference of 0.020%), Somali (97.0%, a difference of 0.040%), Immigrants from Somalia (96.9%, a difference of 0.040%), and Central American Indian (97.0%, a difference of 0.060%).
| Demographics | Rating | Rank | 2nd Grade |
| Immigrants | Immigrants | 0.0 /100 | #296 | Tragic 97.1% |
| Immigrants | Cuba | 0.0 /100 | #297 | Tragic 97.0% |
| Immigrants | Dominica | 0.0 /100 | #298 | Tragic 97.0% |
| Haitians | 0.0 /100 | #299 | Tragic 97.0% |
| Immigrants | South Eastern Asia | 0.0 /100 | #300 | Tragic 97.0% |
| Central American Indians | 0.0 /100 | #301 | Tragic 97.0% |
| Somalis | 0.0 /100 | #302 | Tragic 97.0% |
| Ecuadorians | 0.0 /100 | #303 | Tragic 96.9% |
| Immigrants | Caribbean | 0.0 /100 | #304 | Tragic 96.9% |
| Nicaraguans | 0.0 /100 | #305 | Tragic 96.9% |
| Immigrants | Somalia | 0.0 /100 | #306 | Tragic 96.9% |
| Immigrants | Azores | 0.0 /100 | #307 | Tragic 96.8% |
| Immigrants | Haiti | 0.0 /100 | #308 | Tragic 96.8% |
| Belizeans | 0.0 /100 | #309 | Tragic 96.8% |
| Sri Lankans | 0.0 /100 | #310 | Tragic 96.8% |
Demographics Similar to Immigrants from South America by 2nd Grade
In terms of 2nd grade, the demographic groups most similar to Immigrants from South America are Taiwanese (97.4%, a difference of 0.0%), Immigrants from Ethiopia (97.4%, a difference of 0.0%), Immigrants from Liberia (97.4%, a difference of 0.0%), Immigrants from Sierra Leone (97.4%, a difference of 0.0%), and Fijian (97.5%, a difference of 0.020%).
| Demographics | Rating | Rank | 2nd Grade |
| Yaqui | 0.5 /100 | #258 | Tragic 97.5% |
| Fijians | 0.5 /100 | #259 | Tragic 97.5% |
| Assyrians/Chaldeans/Syriacs | 0.5 /100 | #260 | Tragic 97.5% |
| Armenians | 0.5 /100 | #261 | Tragic 97.5% |
| Taiwanese | 0.4 /100 | #262 | Tragic 97.4% |
| Immigrants | Ethiopia | 0.4 /100 | #263 | Tragic 97.4% |
| Immigrants | Liberia | 0.4 /100 | #264 | Tragic 97.4% |
| Immigrants | South America | 0.4 /100 | #265 | Tragic 97.4% |
| Immigrants | Sierra Leone | 0.4 /100 | #266 | Tragic 97.4% |
| Cubans | 0.3 /100 | #267 | Tragic 97.4% |
| Immigrants | Nigeria | 0.3 /100 | #268 | Tragic 97.4% |
| West Indians | 0.3 /100 | #269 | Tragic 97.4% |
| Immigrants | Jamaica | 0.2 /100 | #270 | Tragic 97.4% |
| Immigrants | Cameroon | 0.2 /100 | #271 | Tragic 97.4% |
| Immigrants | Peru | 0.1 /100 | #272 | Tragic 97.4% |