Dutch West Indian vs Colombian 9th Grade
COMPARE
Dutch West Indian
Colombian
9th Grade
9th Grade Comparison
Dutch West Indians
Colombians
94.2%
9TH GRADE
2.0/ 100
METRIC RATING
244th/ 347
METRIC RANK
94.0%
9TH GRADE
0.8/ 100
METRIC RATING
253rd/ 347
METRIC RANK
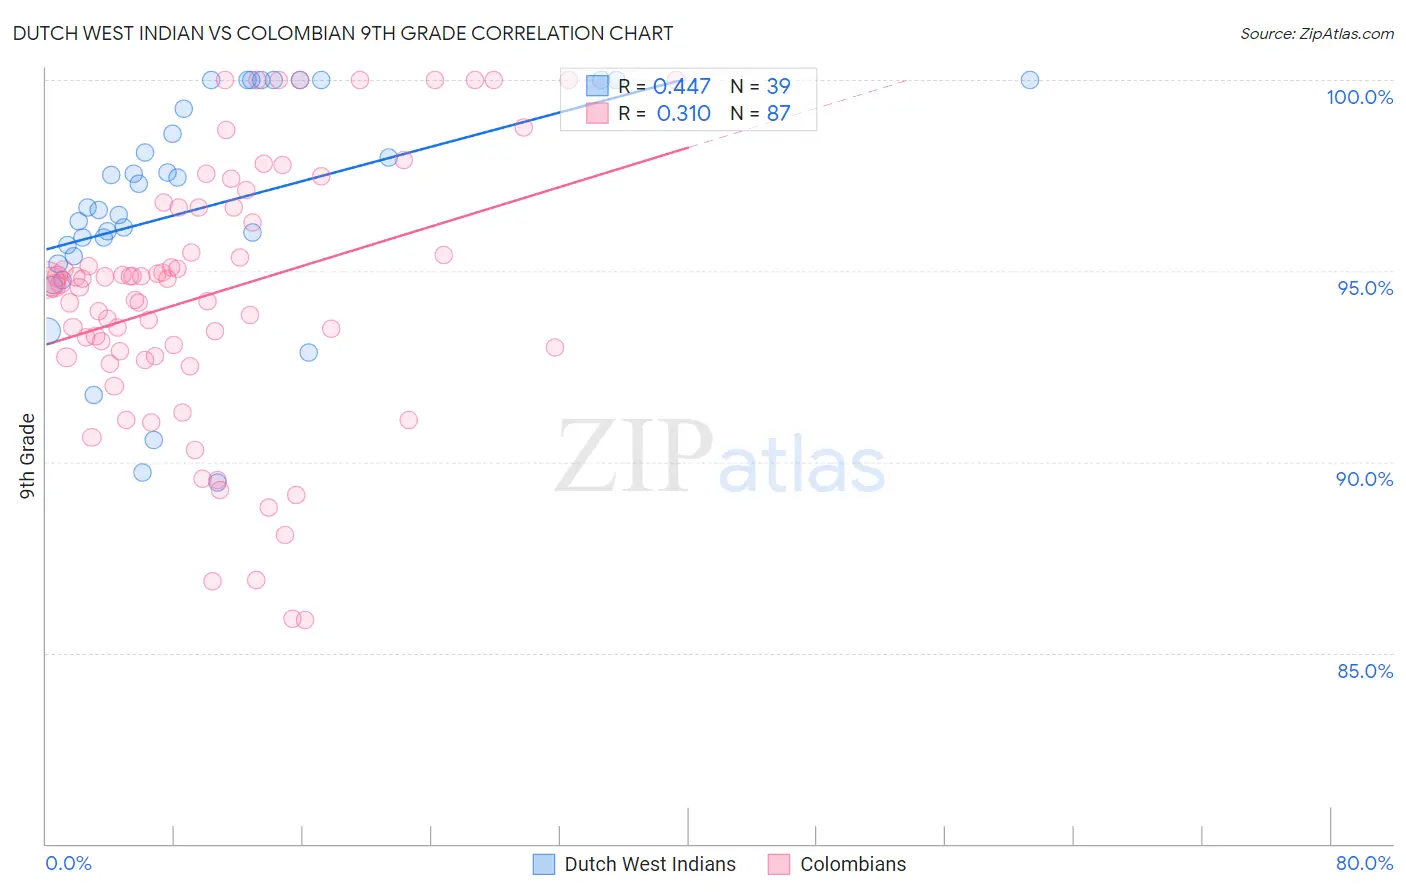
Dutch West Indian vs Colombian 9th Grade Correlation Chart
The statistical analysis conducted on geographies consisting of 85,776,122 people shows a moderate positive correlation between the proportion of Dutch West Indians and percentage of population with at least 9th grade education in the United States with a correlation coefficient (R) of 0.447 and weighted average of 94.2%. Similarly, the statistical analysis conducted on geographies consisting of 419,655,116 people shows a mild positive correlation between the proportion of Colombians and percentage of population with at least 9th grade education in the United States with a correlation coefficient (R) of 0.310 and weighted average of 94.0%, a difference of 0.16%.
9th Grade Correlation Summary
| Measurement | Dutch West Indian | Colombian |
| Minimum | 89.5% | 85.8% |
| Maximum | 100.0% | 100.0% |
| Range | 10.5% | 14.2% |
| Mean | 96.7% | 94.4% |
| Median | 96.7% | 94.7% |
| Interquartile 25% (IQ1) | 95.4% | 92.8% |
| Interquartile 75% (IQ3) | 100.0% | 96.7% |
| Interquartile Range (IQR) | 4.6% | 3.9% |
| Standard Deviation (Sample) | 2.9% | 3.4% |
| Standard Deviation (Population) | 2.9% | 3.4% |
Demographics Similar to Dutch West Indians and Colombians by 9th Grade
In terms of 9th grade, the demographic groups most similar to Dutch West Indians are Immigrants from Middle Africa (94.2%, a difference of 0.010%), Immigrants from Cameroon (94.2%, a difference of 0.010%), Paiute (94.2%, a difference of 0.010%), Senegalese (94.2%, a difference of 0.010%), and Afghan (94.2%, a difference of 0.020%). Similarly, the demographic groups most similar to Colombians are Immigrants from Senegal (94.1%, a difference of 0.020%), Jamaican (94.1%, a difference of 0.030%), U.S. Virgin Islander (94.0%, a difference of 0.030%), Immigrants from Nigeria (94.0%, a difference of 0.070%), and Uruguayan (94.1%, a difference of 0.080%).
| Demographics | Rating | Rank | 9th Grade |
| South American Indians | 2.8 /100 | #238 | Tragic 94.3% |
| Immigrants | China | 2.8 /100 | #239 | Tragic 94.3% |
| Immigrants | Ethiopia | 2.7 /100 | #240 | Tragic 94.3% |
| Spanish Americans | 2.6 /100 | #241 | Tragic 94.2% |
| Immigrants | Middle Africa | 2.2 /100 | #242 | Tragic 94.2% |
| Immigrants | Cameroon | 2.1 /100 | #243 | Tragic 94.2% |
| Dutch West Indians | 2.0 /100 | #244 | Tragic 94.2% |
| Paiute | 1.9 /100 | #245 | Tragic 94.2% |
| Senegalese | 1.9 /100 | #246 | Tragic 94.2% |
| Afghans | 1.8 /100 | #247 | Tragic 94.2% |
| Immigrants | Somalia | 1.4 /100 | #248 | Tragic 94.1% |
| Uruguayans | 1.3 /100 | #249 | Tragic 94.1% |
| Immigrants | Hong Kong | 1.3 /100 | #250 | Tragic 94.1% |
| Jamaicans | 1.0 /100 | #251 | Tragic 94.1% |
| Immigrants | Senegal | 0.9 /100 | #252 | Tragic 94.1% |
| Colombians | 0.8 /100 | #253 | Tragic 94.0% |
| U.S. Virgin Islanders | 0.7 /100 | #254 | Tragic 94.0% |
| Immigrants | Nigeria | 0.6 /100 | #255 | Tragic 94.0% |
| Immigrants | Afghanistan | 0.5 /100 | #256 | Tragic 94.0% |
| Immigrants | Costa Rica | 0.5 /100 | #257 | Tragic 94.0% |
| Immigrants | Thailand | 0.5 /100 | #258 | Tragic 93.9% |