Dutch West Indian vs Assyrian/Chaldean/Syriac 10th Grade
COMPARE
Dutch West Indian
Assyrian/Chaldean/Syriac
10th Grade
10th Grade Comparison
Dutch West Indians
Assyrians/Chaldeans/Syriacs
92.6%
10TH GRADE
0.4/ 100
METRIC RATING
265th/ 347
METRIC RANK
93.9%
10TH GRADE
69.7/ 100
METRIC RATING
161st/ 347
METRIC RANK
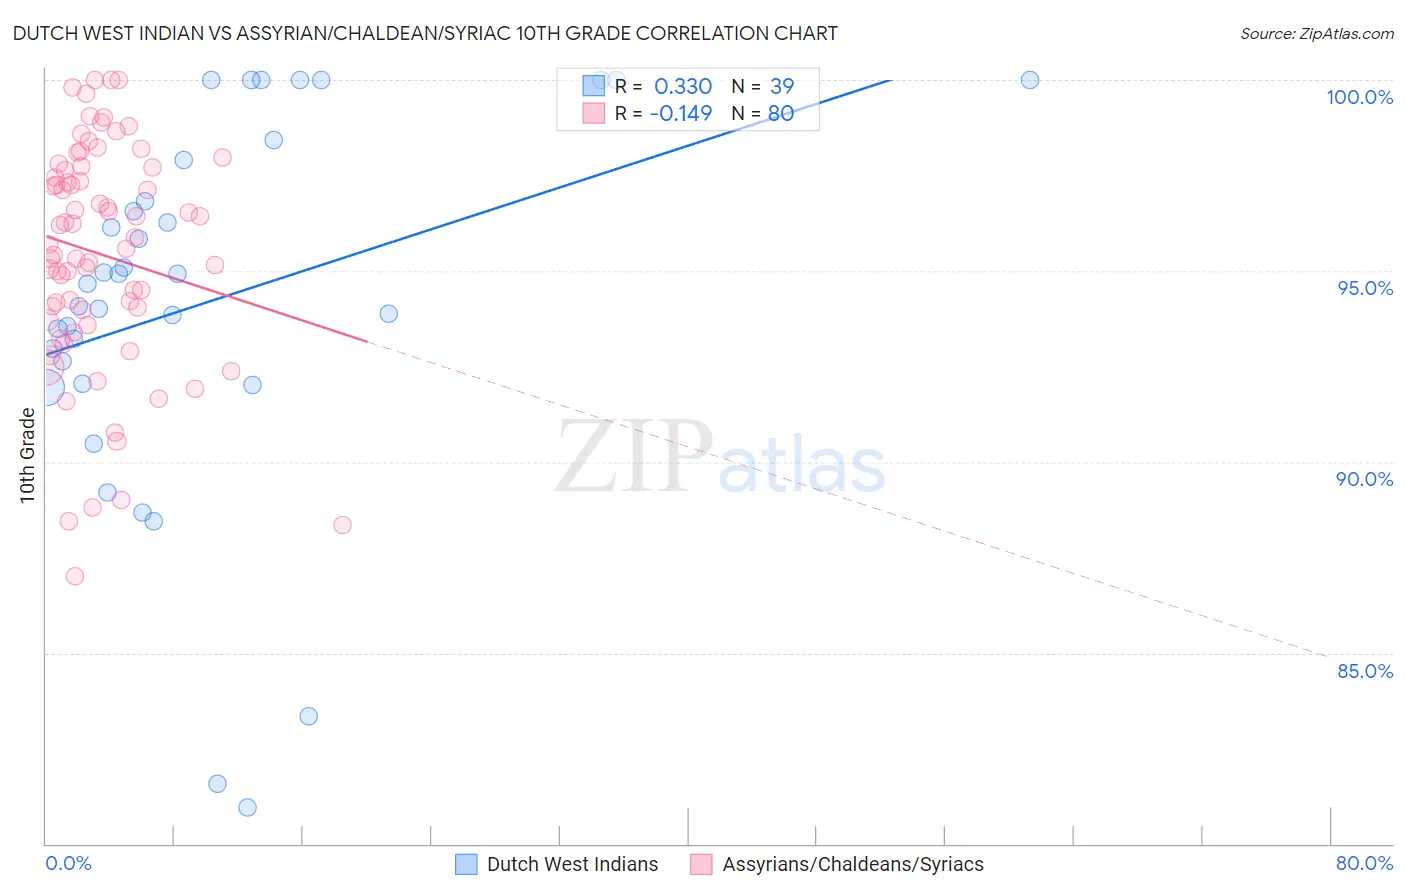
Dutch West Indian vs Assyrian/Chaldean/Syriac 10th Grade Correlation Chart
The statistical analysis conducted on geographies consisting of 85,776,122 people shows a mild positive correlation between the proportion of Dutch West Indians and percentage of population with at least 10th grade education in the United States with a correlation coefficient (R) of 0.330 and weighted average of 92.6%. Similarly, the statistical analysis conducted on geographies consisting of 110,318,125 people shows a poor negative correlation between the proportion of Assyrians/Chaldeans/Syriacs and percentage of population with at least 10th grade education in the United States with a correlation coefficient (R) of -0.149 and weighted average of 93.9%, a difference of 1.5%.
10th Grade Correlation Summary
| Measurement | Dutch West Indian | Assyrian/Chaldean/Syriac |
| Minimum | 81.0% | 87.0% |
| Maximum | 100.0% | 100.0% |
| Range | 19.0% | 13.0% |
| Mean | 94.2% | 95.4% |
| Median | 94.7% | 95.8% |
| Interquartile 25% (IQ1) | 92.0% | 93.9% |
| Interquartile 75% (IQ3) | 97.9% | 97.7% |
| Interquartile Range (IQR) | 5.9% | 3.8% |
| Standard Deviation (Sample) | 4.9% | 3.0% |
| Standard Deviation (Population) | 4.8% | 2.9% |
Similar Demographics by 10th Grade
Demographics Similar to Dutch West Indians by 10th Grade
In terms of 10th grade, the demographic groups most similar to Dutch West Indians are Immigrants from Philippines (92.6%, a difference of 0.0%), Taiwanese (92.5%, a difference of 0.010%), Immigrants from Ghana (92.5%, a difference of 0.010%), Immigrants from South America (92.6%, a difference of 0.030%), and Apache (92.6%, a difference of 0.030%).
| Demographics | Rating | Rank | 10th Grade |
| Immigrants | Costa Rica | 0.6 /100 | #258 | Tragic 92.7% |
| Immigrants | Jamaica | 0.5 /100 | #259 | Tragic 92.6% |
| Immigrants | Uzbekistan | 0.5 /100 | #260 | Tragic 92.6% |
| Paiute | 0.4 /100 | #261 | Tragic 92.6% |
| Immigrants | South America | 0.4 /100 | #262 | Tragic 92.6% |
| Apache | 0.4 /100 | #263 | Tragic 92.6% |
| Peruvians | 0.4 /100 | #264 | Tragic 92.6% |
| Dutch West Indians | 0.4 /100 | #265 | Tragic 92.6% |
| Immigrants | Philippines | 0.4 /100 | #266 | Tragic 92.6% |
| Taiwanese | 0.3 /100 | #267 | Tragic 92.5% |
| Immigrants | Ghana | 0.3 /100 | #268 | Tragic 92.5% |
| Immigrants | Colombia | 0.3 /100 | #269 | Tragic 92.5% |
| Immigrants | Uruguay | 0.3 /100 | #270 | Tragic 92.5% |
| Immigrants | Eritrea | 0.3 /100 | #271 | Tragic 92.5% |
| Immigrants | Western Africa | 0.3 /100 | #272 | Tragic 92.5% |
Demographics Similar to Assyrians/Chaldeans/Syriacs by 10th Grade
In terms of 10th grade, the demographic groups most similar to Assyrians/Chaldeans/Syriacs are Pakistani (93.9%, a difference of 0.0%), Immigrants from Poland (93.9%, a difference of 0.0%), Venezuelan (93.9%, a difference of 0.0%), Bermudan (93.9%, a difference of 0.010%), and Chilean (93.9%, a difference of 0.010%).
| Demographics | Rating | Rank | 10th Grade |
| Immigrants | Kenya | 75.3 /100 | #154 | Good 94.0% |
| Spanish | 74.9 /100 | #155 | Good 94.0% |
| Mongolians | 74.4 /100 | #156 | Good 94.0% |
| Kiowa | 73.3 /100 | #157 | Good 93.9% |
| Bermudans | 71.0 /100 | #158 | Good 93.9% |
| Chileans | 70.2 /100 | #159 | Good 93.9% |
| Pakistanis | 70.1 /100 | #160 | Good 93.9% |
| Assyrians/Chaldeans/Syriacs | 69.7 /100 | #161 | Good 93.9% |
| Immigrants | Poland | 69.6 /100 | #162 | Good 93.9% |
| Venezuelans | 69.5 /100 | #163 | Good 93.9% |
| Iraqis | 68.1 /100 | #164 | Good 93.9% |
| Brazilians | 63.6 /100 | #165 | Good 93.8% |
| Immigrants | Iraq | 63.0 /100 | #166 | Good 93.8% |
| Immigrants | Egypt | 62.3 /100 | #167 | Good 93.8% |
| Alsatians | 59.4 /100 | #168 | Average 93.8% |