Dutch West Indian vs Immigrants from Barbados 10th Grade
COMPARE
Dutch West Indian
Immigrants from Barbados
10th Grade
10th Grade Comparison
Dutch West Indians
Immigrants from Barbados
92.6%
10TH GRADE
0.4/ 100
METRIC RATING
265th/ 347
METRIC RANK
92.1%
10TH GRADE
0.0/ 100
METRIC RATING
284th/ 347
METRIC RANK
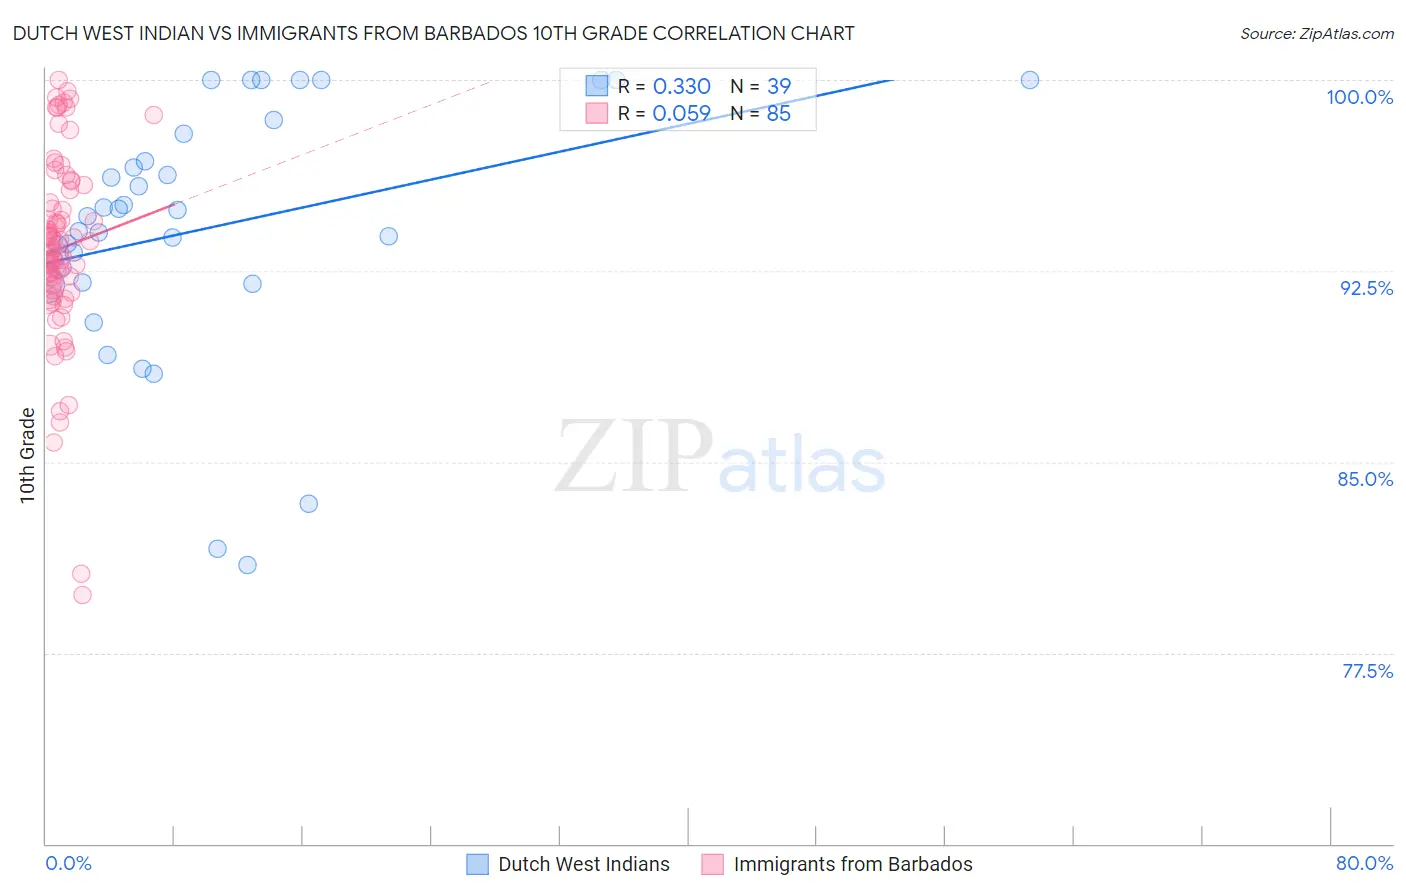
Dutch West Indian vs Immigrants from Barbados 10th Grade Correlation Chart
The statistical analysis conducted on geographies consisting of 85,776,122 people shows a mild positive correlation between the proportion of Dutch West Indians and percentage of population with at least 10th grade education in the United States with a correlation coefficient (R) of 0.330 and weighted average of 92.6%. Similarly, the statistical analysis conducted on geographies consisting of 112,782,130 people shows a slight positive correlation between the proportion of Immigrants from Barbados and percentage of population with at least 10th grade education in the United States with a correlation coefficient (R) of 0.059 and weighted average of 92.1%, a difference of 0.51%.
10th Grade Correlation Summary
| Measurement | Dutch West Indian | Immigrants from Barbados |
| Minimum | 81.0% | 79.8% |
| Maximum | 100.0% | 100.0% |
| Range | 19.0% | 20.2% |
| Mean | 94.2% | 93.4% |
| Median | 94.7% | 93.2% |
| Interquartile 25% (IQ1) | 92.0% | 91.9% |
| Interquartile 75% (IQ3) | 97.9% | 95.4% |
| Interquartile Range (IQR) | 5.9% | 3.6% |
| Standard Deviation (Sample) | 4.9% | 3.7% |
| Standard Deviation (Population) | 4.8% | 3.7% |
Demographics Similar to Dutch West Indians and Immigrants from Barbados by 10th Grade
In terms of 10th grade, the demographic groups most similar to Dutch West Indians are Immigrants from Philippines (92.6%, a difference of 0.0%), Taiwanese (92.5%, a difference of 0.010%), Immigrants from Ghana (92.5%, a difference of 0.010%), Peruvian (92.6%, a difference of 0.030%), and Immigrants from Colombia (92.5%, a difference of 0.030%). Similarly, the demographic groups most similar to Immigrants from Barbados are Immigrants from St. Vincent and the Grenadines (92.1%, a difference of 0.020%), Immigrants from Peru (92.2%, a difference of 0.080%), Bangladeshi (92.2%, a difference of 0.10%), Malaysian (92.2%, a difference of 0.11%), and Native/Alaskan (92.2%, a difference of 0.14%).
| Demographics | Rating | Rank | 10th Grade |
| Peruvians | 0.4 /100 | #264 | Tragic 92.6% |
| Dutch West Indians | 0.4 /100 | #265 | Tragic 92.6% |
| Immigrants | Philippines | 0.4 /100 | #266 | Tragic 92.6% |
| Taiwanese | 0.3 /100 | #267 | Tragic 92.5% |
| Immigrants | Ghana | 0.3 /100 | #268 | Tragic 92.5% |
| Immigrants | Colombia | 0.3 /100 | #269 | Tragic 92.5% |
| Immigrants | Uruguay | 0.3 /100 | #270 | Tragic 92.5% |
| Immigrants | Eritrea | 0.3 /100 | #271 | Tragic 92.5% |
| Immigrants | Western Africa | 0.3 /100 | #272 | Tragic 92.5% |
| Trinidadians and Tobagonians | 0.2 /100 | #273 | Tragic 92.4% |
| Immigrants | Congo | 0.2 /100 | #274 | Tragic 92.4% |
| West Indians | 0.2 /100 | #275 | Tragic 92.4% |
| Immigrants | Trinidad and Tobago | 0.1 /100 | #276 | Tragic 92.3% |
| Navajo | 0.1 /100 | #277 | Tragic 92.3% |
| Barbadians | 0.1 /100 | #278 | Tragic 92.2% |
| Natives/Alaskans | 0.1 /100 | #279 | Tragic 92.2% |
| Malaysians | 0.1 /100 | #280 | Tragic 92.2% |
| Bangladeshis | 0.1 /100 | #281 | Tragic 92.2% |
| Immigrants | Peru | 0.1 /100 | #282 | Tragic 92.2% |
| Immigrants | St. Vincent and the Grenadines | 0.0 /100 | #283 | Tragic 92.1% |
| Immigrants | Barbados | 0.0 /100 | #284 | Tragic 92.1% |