South African vs Bangladeshi 2nd Grade
COMPARE
South African
Bangladeshi
2nd Grade
2nd Grade Comparison
South Africans
Bangladeshis
98.2%
2ND GRADE
98.6/ 100
METRIC RATING
95th/ 347
METRIC RANK
96.5%
2ND GRADE
0.0/ 100
METRIC RATING
332nd/ 347
METRIC RANK
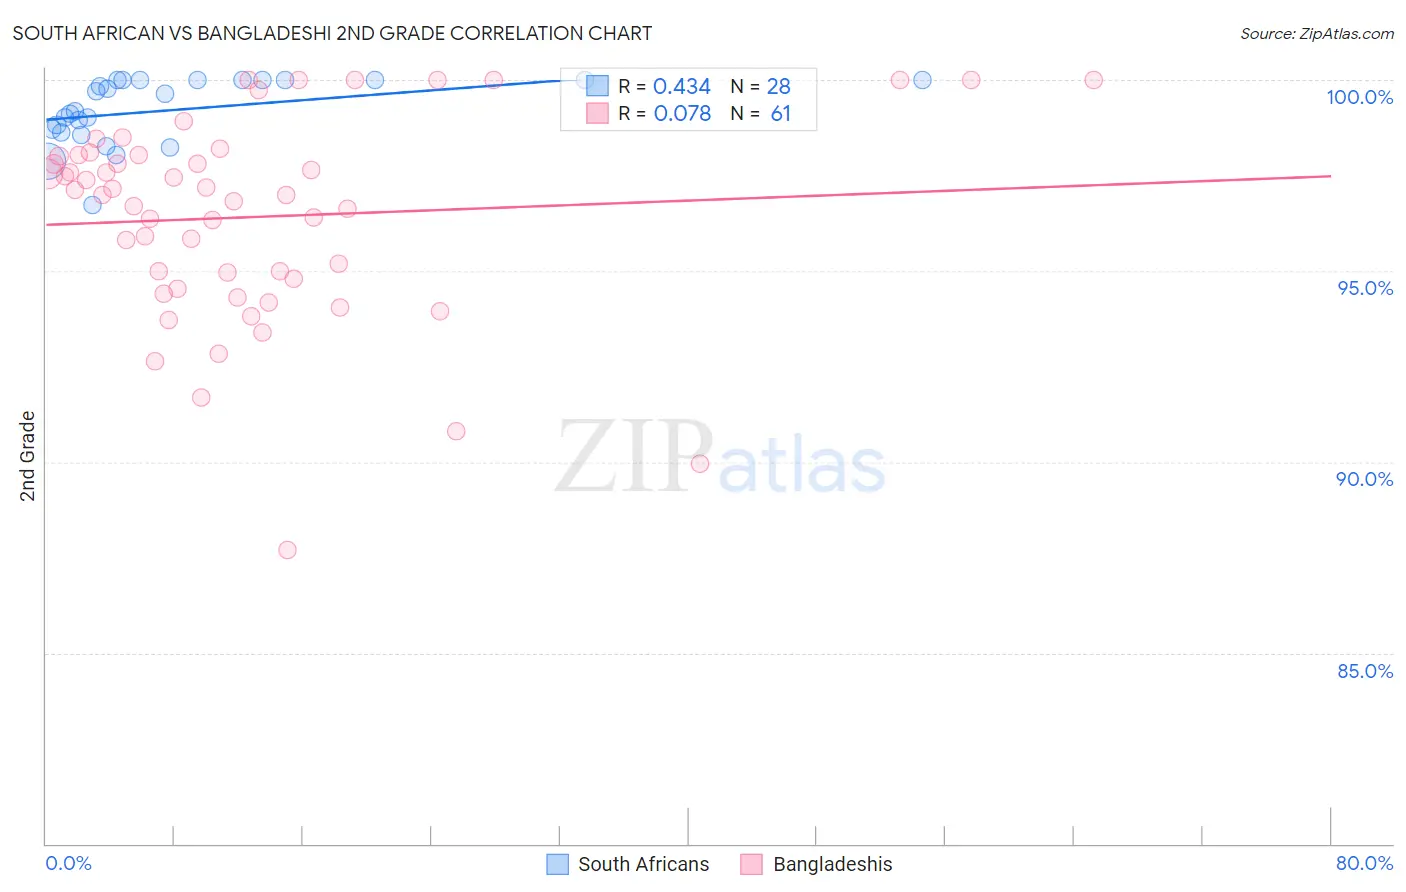
South African vs Bangladeshi 2nd Grade Correlation Chart
The statistical analysis conducted on geographies consisting of 182,602,894 people shows a moderate positive correlation between the proportion of South Africans and percentage of population with at least 2nd grade education in the United States with a correlation coefficient (R) of 0.434 and weighted average of 98.2%. Similarly, the statistical analysis conducted on geographies consisting of 141,430,495 people shows a slight positive correlation between the proportion of Bangladeshis and percentage of population with at least 2nd grade education in the United States with a correlation coefficient (R) of 0.078 and weighted average of 96.5%, a difference of 1.8%.
2nd Grade Correlation Summary
| Measurement | South African | Bangladeshi |
| Minimum | 96.7% | 87.7% |
| Maximum | 100.0% | 100.0% |
| Range | 3.3% | 12.3% |
| Mean | 99.2% | 96.4% |
| Median | 99.4% | 97.0% |
| Interquartile 25% (IQ1) | 98.7% | 94.7% |
| Interquartile 75% (IQ3) | 100.0% | 98.0% |
| Interquartile Range (IQR) | 1.3% | 3.4% |
| Standard Deviation (Sample) | 0.86% | 2.6% |
| Standard Deviation (Population) | 0.84% | 2.6% |
Similar Demographics by 2nd Grade
Demographics Similar to South Africans by 2nd Grade
In terms of 2nd grade, the demographic groups most similar to South Africans are Immigrants from Germany (98.2%, a difference of 0.0%), Immigrants from India (98.2%, a difference of 0.010%), Cypriot (98.2%, a difference of 0.010%), Ukrainian (98.2%, a difference of 0.020%), and Zimbabwean (98.2%, a difference of 0.020%).
| Demographics | Rating | Rank | 2nd Grade |
| Macedonians | 99.0 /100 | #88 | Exceptional 98.2% |
| Ukrainians | 98.9 /100 | #89 | Exceptional 98.2% |
| Zimbabweans | 98.8 /100 | #90 | Exceptional 98.2% |
| Immigrants | Western Europe | 98.8 /100 | #91 | Exceptional 98.2% |
| Immigrants | South Africa | 98.8 /100 | #92 | Exceptional 98.2% |
| Immigrants | India | 98.8 /100 | #93 | Exceptional 98.2% |
| Immigrants | Germany | 98.6 /100 | #94 | Exceptional 98.2% |
| South Africans | 98.6 /100 | #95 | Exceptional 98.2% |
| Cypriots | 98.4 /100 | #96 | Exceptional 98.2% |
| Choctaw | 98.3 /100 | #97 | Exceptional 98.2% |
| Immigrants | Nonimmigrants | 98.3 /100 | #98 | Exceptional 98.2% |
| Immigrants | Ireland | 98.0 /100 | #99 | Exceptional 98.2% |
| Romanians | 98.0 /100 | #100 | Exceptional 98.2% |
| Puget Sound Salish | 98.0 /100 | #101 | Exceptional 98.2% |
| Cree | 98.0 /100 | #102 | Exceptional 98.2% |
Demographics Similar to Bangladeshis by 2nd Grade
In terms of 2nd grade, the demographic groups most similar to Bangladeshis are Immigrants from Armenia (96.5%, a difference of 0.010%), Immigrants from Latin America (96.5%, a difference of 0.050%), Immigrants from Vietnam (96.5%, a difference of 0.060%), Mexican (96.5%, a difference of 0.060%), and Japanese (96.5%, a difference of 0.060%).
| Demographics | Rating | Rank | 2nd Grade |
| Dominicans | 0.0 /100 | #325 | Tragic 96.6% |
| Immigrants | Honduras | 0.0 /100 | #326 | Tragic 96.6% |
| Immigrants | Vietnam | 0.0 /100 | #327 | Tragic 96.5% |
| Mexicans | 0.0 /100 | #328 | Tragic 96.5% |
| Japanese | 0.0 /100 | #329 | Tragic 96.5% |
| Immigrants | Latin America | 0.0 /100 | #330 | Tragic 96.5% |
| Immigrants | Armenia | 0.0 /100 | #331 | Tragic 96.5% |
| Bangladeshis | 0.0 /100 | #332 | Tragic 96.5% |
| Immigrants | Dominican Republic | 0.0 /100 | #333 | Tragic 96.4% |
| Central Americans | 0.0 /100 | #334 | Tragic 96.4% |
| Yakama | 0.0 /100 | #335 | Tragic 96.4% |
| Immigrants | Fiji | 0.0 /100 | #336 | Tragic 96.4% |
| Immigrants | Cambodia | 0.0 /100 | #337 | Tragic 96.4% |
| Immigrants | Cabo Verde | 0.0 /100 | #338 | Tragic 96.3% |
| Guatemalans | 0.0 /100 | #339 | Tragic 96.3% |