Dominican vs Israeli College, 1 year or more
COMPARE
Dominican
Israeli
College, 1 year or more
College, 1 year or more Comparison
Dominicans
Israelis
50.6%
COLLEGE, 1 YEAR OR MORE
0.0/ 100
METRIC RATING
326th/ 347
METRIC RANK
65.3%
COLLEGE, 1 YEAR OR MORE
99.9/ 100
METRIC RATING
34th/ 347
METRIC RANK
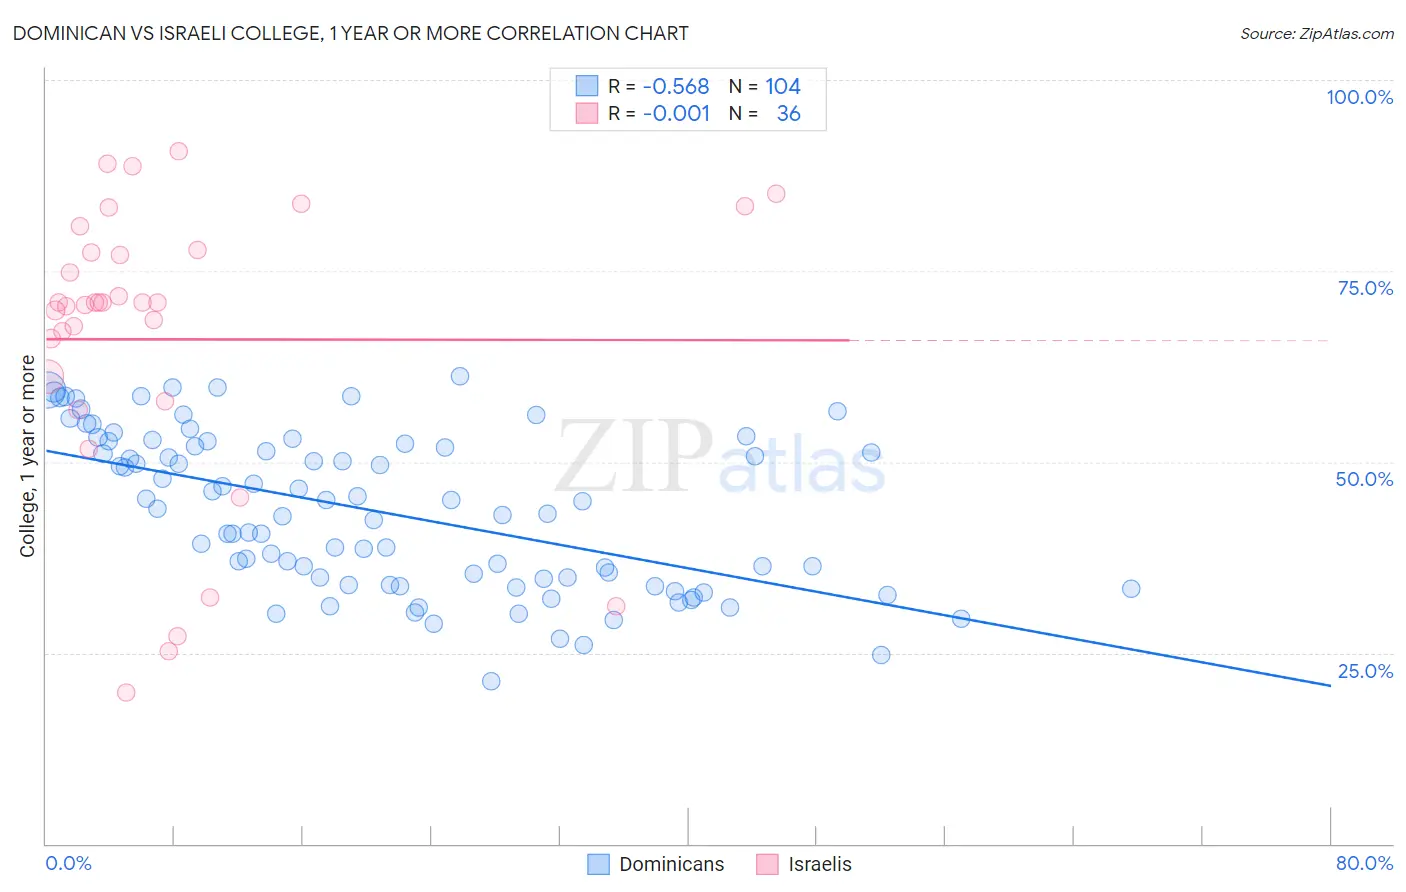
Dominican vs Israeli College, 1 year or more Correlation Chart
The statistical analysis conducted on geographies consisting of 355,140,033 people shows a substantial negative correlation between the proportion of Dominicans and percentage of population with at least college, 1 year or more education in the United States with a correlation coefficient (R) of -0.568 and weighted average of 50.6%. Similarly, the statistical analysis conducted on geographies consisting of 211,218,479 people shows no correlation between the proportion of Israelis and percentage of population with at least college, 1 year or more education in the United States with a correlation coefficient (R) of -0.001 and weighted average of 65.3%, a difference of 29.1%.
College, 1 year or more Correlation Summary
| Measurement | Dominican | Israeli |
| Minimum | 21.3% | 19.8% |
| Maximum | 61.3% | 90.6% |
| Range | 40.0% | 70.9% |
| Mean | 43.4% | 66.0% |
| Median | 43.6% | 70.8% |
| Interquartile 25% (IQ1) | 34.3% | 59.5% |
| Interquartile 75% (IQ3) | 52.2% | 77.6% |
| Interquartile Range (IQR) | 17.8% | 18.0% |
| Standard Deviation (Sample) | 10.1% | 18.8% |
| Standard Deviation (Population) | 10.1% | 18.5% |
Similar Demographics by College, 1 year or more
Demographics Similar to Dominicans by College, 1 year or more
In terms of college, 1 year or more, the demographic groups most similar to Dominicans are Menominee (50.6%, a difference of 0.040%), Dutch West Indian (50.5%, a difference of 0.15%), Immigrants from Latin America (50.7%, a difference of 0.18%), Immigrants from Cuba (50.7%, a difference of 0.21%), and Immigrants from Guatemala (50.7%, a difference of 0.22%).
| Demographics | Rating | Rank | College, 1 year or more |
| Immigrants | El Salvador | 0.0 /100 | #319 | Tragic 51.0% |
| Kiowa | 0.0 /100 | #320 | Tragic 51.0% |
| Hopi | 0.0 /100 | #321 | Tragic 50.9% |
| Navajo | 0.0 /100 | #322 | Tragic 50.8% |
| Immigrants | Guatemala | 0.0 /100 | #323 | Tragic 50.7% |
| Immigrants | Cuba | 0.0 /100 | #324 | Tragic 50.7% |
| Immigrants | Latin America | 0.0 /100 | #325 | Tragic 50.7% |
| Dominicans | 0.0 /100 | #326 | Tragic 50.6% |
| Menominee | 0.0 /100 | #327 | Tragic 50.6% |
| Dutch West Indians | 0.0 /100 | #328 | Tragic 50.5% |
| Cape Verdeans | 0.0 /100 | #329 | Tragic 50.3% |
| Natives/Alaskans | 0.0 /100 | #330 | Tragic 50.2% |
| Immigrants | Yemen | 0.0 /100 | #331 | Tragic 50.0% |
| Mexicans | 0.0 /100 | #332 | Tragic 49.2% |
| Immigrants | Dominican Republic | 0.0 /100 | #333 | Tragic 49.1% |
Demographics Similar to Israelis by College, 1 year or more
In terms of college, 1 year or more, the demographic groups most similar to Israelis are Immigrants from Sri Lanka (65.4%, a difference of 0.12%), Immigrants from Turkey (65.2%, a difference of 0.20%), Bulgarian (65.5%, a difference of 0.27%), Immigrants from South Africa (65.1%, a difference of 0.28%), and Russian (65.1%, a difference of 0.28%).
| Demographics | Rating | Rank | College, 1 year or more |
| Immigrants | Ireland | 100.0 /100 | #27 | Exceptional 65.9% |
| Immigrants | France | 100.0 /100 | #28 | Exceptional 65.8% |
| Immigrants | Northern Europe | 100.0 /100 | #29 | Exceptional 65.6% |
| Immigrants | Denmark | 100.0 /100 | #30 | Exceptional 65.6% |
| Turks | 100.0 /100 | #31 | Exceptional 65.5% |
| Bulgarians | 100.0 /100 | #32 | Exceptional 65.5% |
| Immigrants | Sri Lanka | 99.9 /100 | #33 | Exceptional 65.4% |
| Israelis | 99.9 /100 | #34 | Exceptional 65.3% |
| Immigrants | Turkey | 99.9 /100 | #35 | Exceptional 65.2% |
| Immigrants | South Africa | 99.9 /100 | #36 | Exceptional 65.1% |
| Russians | 99.9 /100 | #37 | Exceptional 65.1% |
| Immigrants | Saudi Arabia | 99.9 /100 | #38 | Exceptional 65.0% |
| Estonians | 99.9 /100 | #39 | Exceptional 65.0% |
| Immigrants | Kuwait | 99.9 /100 | #40 | Exceptional 65.0% |
| Mongolians | 99.9 /100 | #41 | Exceptional 64.8% |