Dominican vs Jamaican 12th Grade, No Diploma
COMPARE
Dominican
Jamaican
12th Grade, No Diploma
12th Grade, No Diploma Comparison
Dominicans
Jamaicans
85.7%
12TH GRADE, NO DIPLOMA
0.0/ 100
METRIC RATING
326th/ 347
METRIC RANK
89.7%
12TH GRADE, NO DIPLOMA
0.5/ 100
METRIC RATING
257th/ 347
METRIC RANK
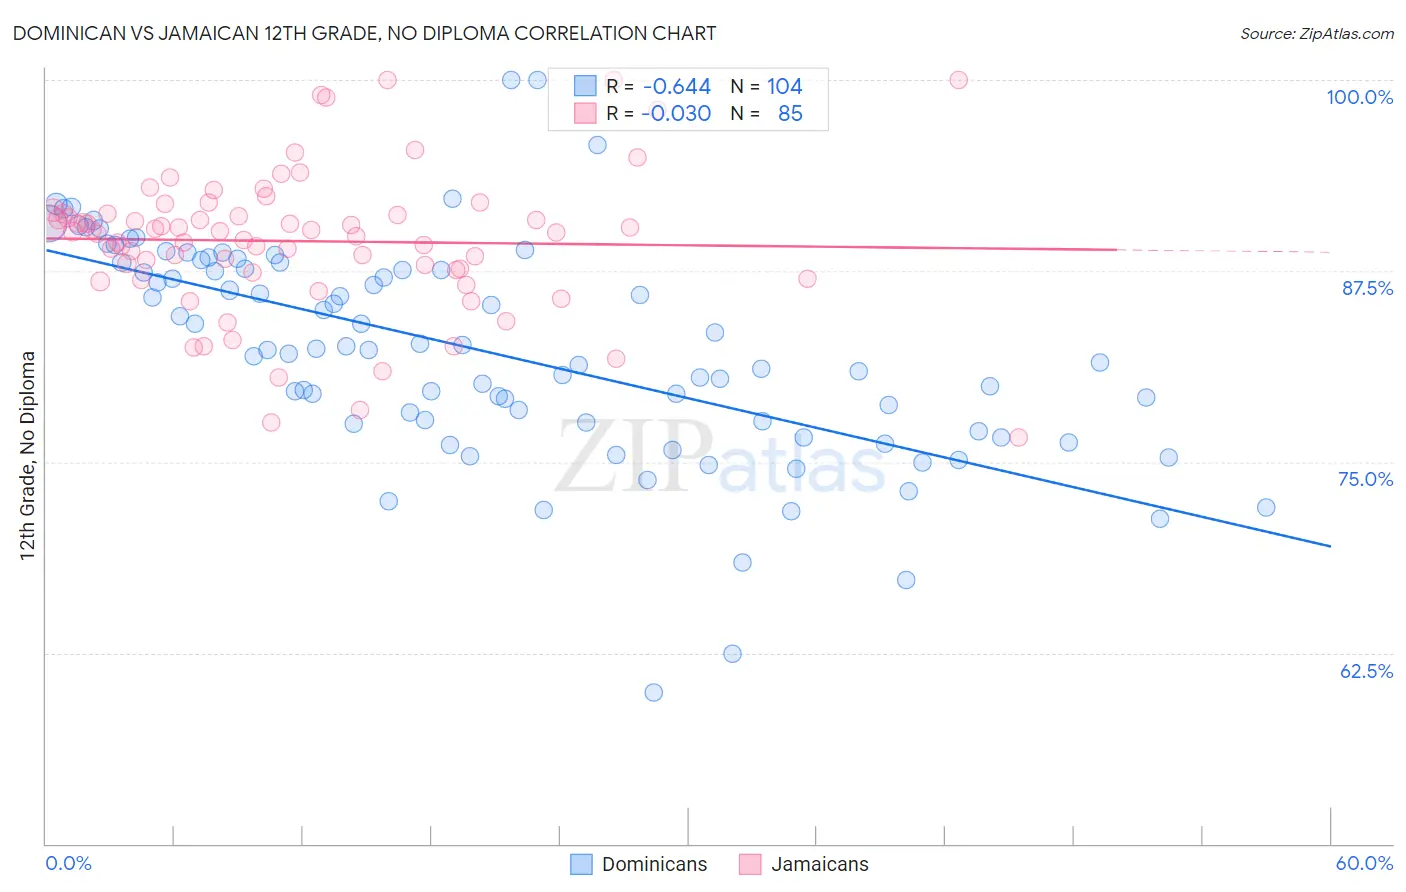
Dominican vs Jamaican 12th Grade, No Diploma Correlation Chart
The statistical analysis conducted on geographies consisting of 355,143,036 people shows a significant negative correlation between the proportion of Dominicans and percentage of population with at least 12th grade (no diploma) education in the United States with a correlation coefficient (R) of -0.644 and weighted average of 85.7%. Similarly, the statistical analysis conducted on geographies consisting of 368,084,732 people shows no correlation between the proportion of Jamaicans and percentage of population with at least 12th grade (no diploma) education in the United States with a correlation coefficient (R) of -0.030 and weighted average of 89.7%, a difference of 4.6%.
12th Grade, No Diploma Correlation Summary
| Measurement | Dominican | Jamaican |
| Minimum | 59.9% | 76.6% |
| Maximum | 100.0% | 100.0% |
| Range | 40.1% | 23.4% |
| Mean | 82.3% | 89.5% |
| Median | 82.3% | 90.1% |
| Interquartile 25% (IQ1) | 77.5% | 87.5% |
| Interquartile 75% (IQ3) | 87.8% | 91.2% |
| Interquartile Range (IQR) | 10.3% | 3.7% |
| Standard Deviation (Sample) | 7.2% | 4.7% |
| Standard Deviation (Population) | 7.1% | 4.6% |
Similar Demographics by 12th Grade, No Diploma
Demographics Similar to Dominicans by 12th Grade, No Diploma
In terms of 12th grade, no diploma, the demographic groups most similar to Dominicans are Lumbee (85.7%, a difference of 0.010%), Mexican American Indian (85.7%, a difference of 0.020%), Immigrants from Cabo Verde (85.8%, a difference of 0.090%), Honduran (85.5%, a difference of 0.20%), and Hispanic or Latino (85.4%, a difference of 0.30%).
| Demographics | Rating | Rank | 12th Grade, No Diploma |
| Immigrants | Belize | 0.0 /100 | #319 | Tragic 87.0% |
| Immigrants | Nicaragua | 0.0 /100 | #320 | Tragic 86.6% |
| Puerto Ricans | 0.0 /100 | #321 | Tragic 86.5% |
| Central American Indians | 0.0 /100 | #322 | Tragic 86.5% |
| Yuman | 0.0 /100 | #323 | Tragic 86.5% |
| Immigrants | Cabo Verde | 0.0 /100 | #324 | Tragic 85.8% |
| Mexican American Indians | 0.0 /100 | #325 | Tragic 85.7% |
| Dominicans | 0.0 /100 | #326 | Tragic 85.7% |
| Lumbee | 0.0 /100 | #327 | Tragic 85.7% |
| Hondurans | 0.0 /100 | #328 | Tragic 85.5% |
| Hispanics or Latinos | 0.0 /100 | #329 | Tragic 85.4% |
| Immigrants | Azores | 0.0 /100 | #330 | Tragic 85.3% |
| Central Americans | 0.0 /100 | #331 | Tragic 85.2% |
| Immigrants | Honduras | 0.0 /100 | #332 | Tragic 85.0% |
| Immigrants | Latin America | 0.0 /100 | #333 | Tragic 85.0% |
Demographics Similar to Jamaicans by 12th Grade, No Diploma
In terms of 12th grade, no diploma, the demographic groups most similar to Jamaicans are Immigrants from Ghana (89.7%, a difference of 0.010%), Immigrants from Peru (89.7%, a difference of 0.020%), Immigrants from Senegal (89.7%, a difference of 0.020%), African (89.6%, a difference of 0.050%), and Immigrants from Western Africa (89.6%, a difference of 0.070%).
| Demographics | Rating | Rank | 12th Grade, No Diploma |
| Immigrants | Eritrea | 1.0 /100 | #250 | Tragic 89.9% |
| Spanish Americans | 0.9 /100 | #251 | Tragic 89.9% |
| Bahamians | 0.9 /100 | #252 | Tragic 89.9% |
| Choctaw | 0.7 /100 | #253 | Tragic 89.8% |
| Immigrants | Peru | 0.5 /100 | #254 | Tragic 89.7% |
| Immigrants | Senegal | 0.5 /100 | #255 | Tragic 89.7% |
| Immigrants | Ghana | 0.5 /100 | #256 | Tragic 89.7% |
| Jamaicans | 0.5 /100 | #257 | Tragic 89.7% |
| Africans | 0.4 /100 | #258 | Tragic 89.6% |
| Immigrants | Western Africa | 0.4 /100 | #259 | Tragic 89.6% |
| Immigrants | South Eastern Asia | 0.4 /100 | #260 | Tragic 89.6% |
| Cheyenne | 0.4 /100 | #261 | Tragic 89.6% |
| Sioux | 0.4 /100 | #262 | Tragic 89.6% |
| Immigrants | Jamaica | 0.2 /100 | #263 | Tragic 89.5% |
| Sri Lankans | 0.2 /100 | #264 | Tragic 89.4% |