Dominican vs Immigrants from Bangladesh 12th Grade, No Diploma
COMPARE
Dominican
Immigrants from Bangladesh
12th Grade, No Diploma
12th Grade, No Diploma Comparison
Dominicans
Immigrants from Bangladesh
85.7%
12TH GRADE, NO DIPLOMA
0.0/ 100
METRIC RATING
326th/ 347
METRIC RANK
88.0%
12TH GRADE, NO DIPLOMA
0.0/ 100
METRIC RATING
303rd/ 347
METRIC RANK
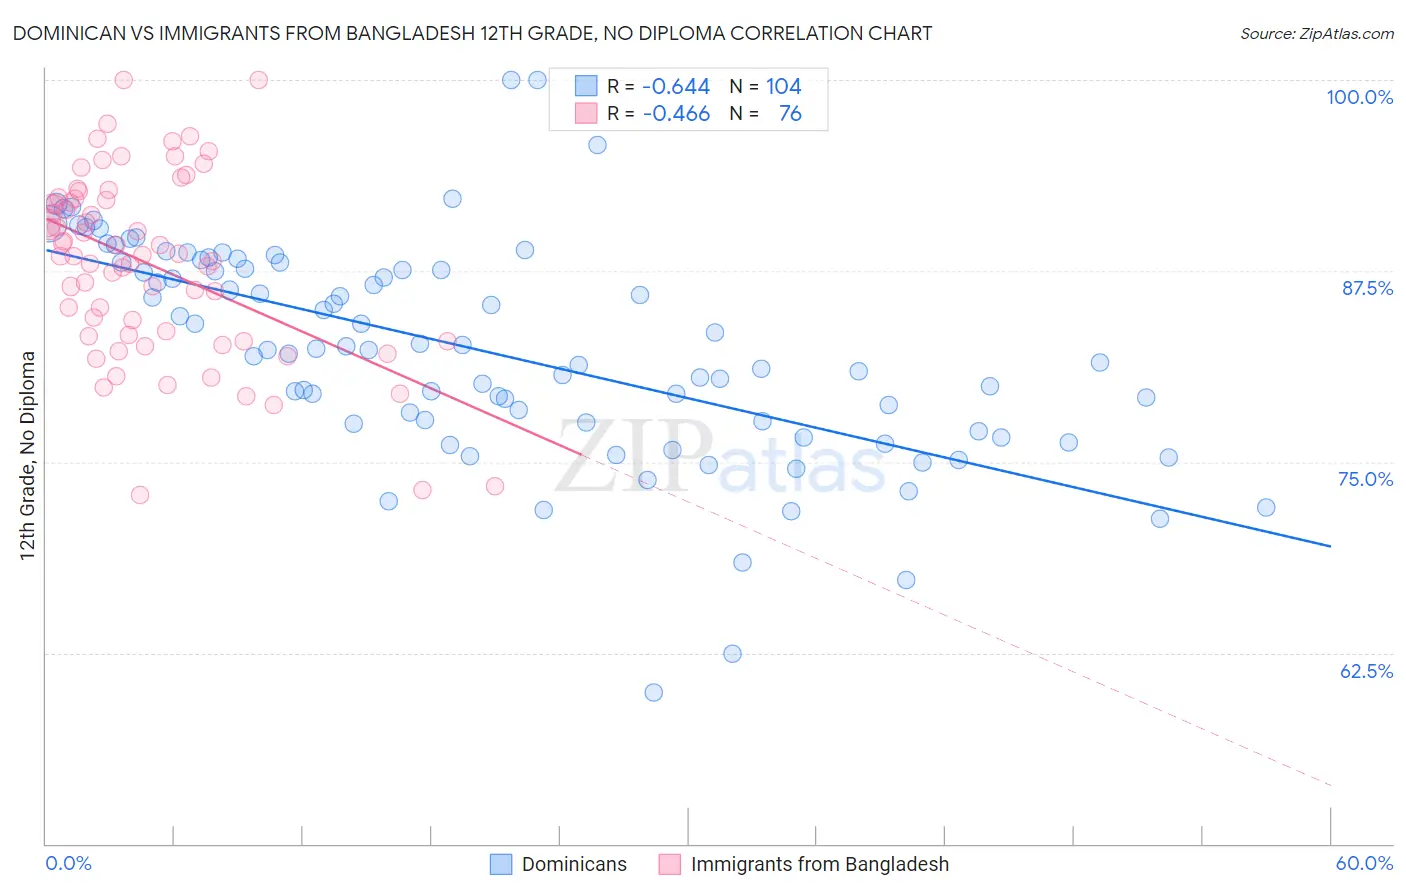
Dominican vs Immigrants from Bangladesh 12th Grade, No Diploma Correlation Chart
The statistical analysis conducted on geographies consisting of 355,143,036 people shows a significant negative correlation between the proportion of Dominicans and percentage of population with at least 12th grade (no diploma) education in the United States with a correlation coefficient (R) of -0.644 and weighted average of 85.7%. Similarly, the statistical analysis conducted on geographies consisting of 203,672,706 people shows a moderate negative correlation between the proportion of Immigrants from Bangladesh and percentage of population with at least 12th grade (no diploma) education in the United States with a correlation coefficient (R) of -0.466 and weighted average of 88.0%, a difference of 2.6%.
12th Grade, No Diploma Correlation Summary
| Measurement | Dominican | Immigrants from Bangladesh |
| Minimum | 59.9% | 72.9% |
| Maximum | 100.0% | 100.0% |
| Range | 40.1% | 27.1% |
| Mean | 82.3% | 88.0% |
| Median | 82.3% | 88.5% |
| Interquartile 25% (IQ1) | 77.5% | 83.3% |
| Interquartile 75% (IQ3) | 87.8% | 92.2% |
| Interquartile Range (IQR) | 10.3% | 8.9% |
| Standard Deviation (Sample) | 7.2% | 6.0% |
| Standard Deviation (Population) | 7.1% | 5.9% |
Similar Demographics by 12th Grade, No Diploma
Demographics Similar to Dominicans by 12th Grade, No Diploma
In terms of 12th grade, no diploma, the demographic groups most similar to Dominicans are Lumbee (85.7%, a difference of 0.010%), Mexican American Indian (85.7%, a difference of 0.020%), Immigrants from Cabo Verde (85.8%, a difference of 0.090%), Honduran (85.5%, a difference of 0.20%), and Hispanic or Latino (85.4%, a difference of 0.30%).
| Demographics | Rating | Rank | 12th Grade, No Diploma |
| Immigrants | Belize | 0.0 /100 | #319 | Tragic 87.0% |
| Immigrants | Nicaragua | 0.0 /100 | #320 | Tragic 86.6% |
| Puerto Ricans | 0.0 /100 | #321 | Tragic 86.5% |
| Central American Indians | 0.0 /100 | #322 | Tragic 86.5% |
| Yuman | 0.0 /100 | #323 | Tragic 86.5% |
| Immigrants | Cabo Verde | 0.0 /100 | #324 | Tragic 85.8% |
| Mexican American Indians | 0.0 /100 | #325 | Tragic 85.7% |
| Dominicans | 0.0 /100 | #326 | Tragic 85.7% |
| Lumbee | 0.0 /100 | #327 | Tragic 85.7% |
| Hondurans | 0.0 /100 | #328 | Tragic 85.5% |
| Hispanics or Latinos | 0.0 /100 | #329 | Tragic 85.4% |
| Immigrants | Azores | 0.0 /100 | #330 | Tragic 85.3% |
| Central Americans | 0.0 /100 | #331 | Tragic 85.2% |
| Immigrants | Honduras | 0.0 /100 | #332 | Tragic 85.0% |
| Immigrants | Latin America | 0.0 /100 | #333 | Tragic 85.0% |
Demographics Similar to Immigrants from Bangladesh by 12th Grade, No Diploma
In terms of 12th grade, no diploma, the demographic groups most similar to Immigrants from Bangladesh are Vietnamese (87.9%, a difference of 0.060%), Ecuadorian (88.0%, a difference of 0.10%), Immigrants from Guyana (88.1%, a difference of 0.13%), Immigrants from Cambodia (88.1%, a difference of 0.13%), and Nepalese (88.1%, a difference of 0.18%).
| Demographics | Rating | Rank | 12th Grade, No Diploma |
| Fijians | 0.0 /100 | #296 | Tragic 88.2% |
| Pueblo | 0.0 /100 | #297 | Tragic 88.2% |
| Immigrants | Haiti | 0.0 /100 | #298 | Tragic 88.2% |
| Nepalese | 0.0 /100 | #299 | Tragic 88.1% |
| Immigrants | Guyana | 0.0 /100 | #300 | Tragic 88.1% |
| Immigrants | Cambodia | 0.0 /100 | #301 | Tragic 88.1% |
| Ecuadorians | 0.0 /100 | #302 | Tragic 88.0% |
| Immigrants | Bangladesh | 0.0 /100 | #303 | Tragic 88.0% |
| Vietnamese | 0.0 /100 | #304 | Tragic 87.9% |
| Immigrants | Dominica | 0.0 /100 | #305 | Tragic 87.7% |
| Natives/Alaskans | 0.0 /100 | #306 | Tragic 87.7% |
| Immigrants | Portugal | 0.0 /100 | #307 | Tragic 87.6% |
| Yup'ik | 0.0 /100 | #308 | Tragic 87.6% |
| Immigrants | Armenia | 0.0 /100 | #309 | Tragic 87.6% |
| Immigrants | Cuba | 0.0 /100 | #310 | Tragic 87.5% |