Immigrants from Uzbekistan vs Jamaican 12th Grade, No Diploma
COMPARE
Immigrants from Uzbekistan
Jamaican
12th Grade, No Diploma
12th Grade, No Diploma Comparison
Immigrants from Uzbekistan
Jamaicans
90.1%
12TH GRADE, NO DIPLOMA
2.2/ 100
METRIC RATING
236th/ 347
METRIC RANK
89.7%
12TH GRADE, NO DIPLOMA
0.5/ 100
METRIC RATING
257th/ 347
METRIC RANK
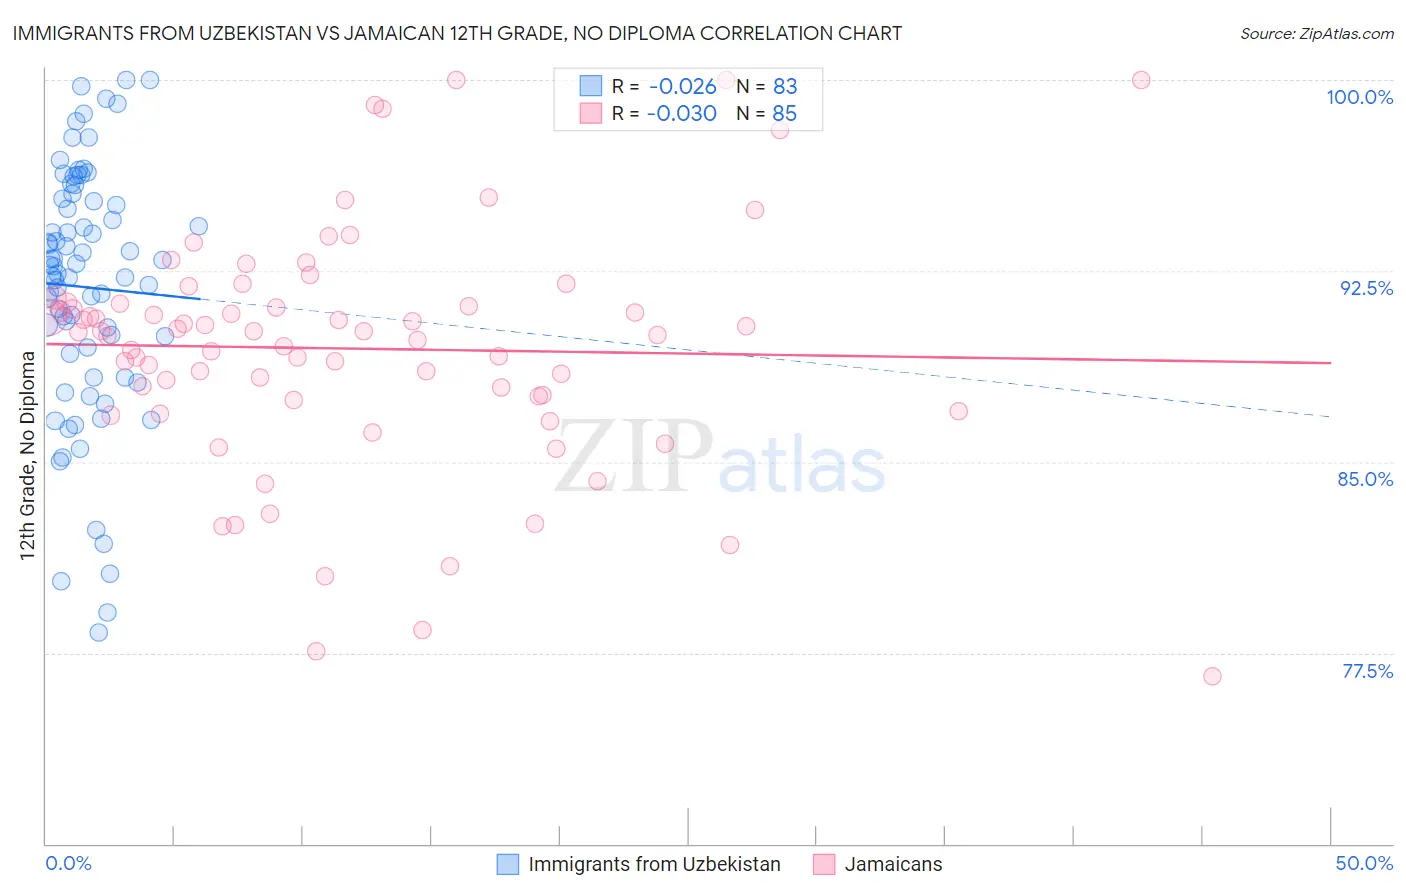
Immigrants from Uzbekistan vs Jamaican 12th Grade, No Diploma Correlation Chart
The statistical analysis conducted on geographies consisting of 118,765,305 people shows no correlation between the proportion of Immigrants from Uzbekistan and percentage of population with at least 12th grade (no diploma) education in the United States with a correlation coefficient (R) of -0.026 and weighted average of 90.1%. Similarly, the statistical analysis conducted on geographies consisting of 368,084,732 people shows no correlation between the proportion of Jamaicans and percentage of population with at least 12th grade (no diploma) education in the United States with a correlation coefficient (R) of -0.030 and weighted average of 89.7%, a difference of 0.48%.
12th Grade, No Diploma Correlation Summary
| Measurement | Immigrants from Uzbekistan | Jamaican |
| Minimum | 78.3% | 76.6% |
| Maximum | 100.0% | 100.0% |
| Range | 21.7% | 23.4% |
| Mean | 91.9% | 89.5% |
| Median | 92.7% | 90.1% |
| Interquartile 25% (IQ1) | 89.2% | 87.5% |
| Interquartile 75% (IQ3) | 95.3% | 91.2% |
| Interquartile Range (IQR) | 6.1% | 3.7% |
| Standard Deviation (Sample) | 4.9% | 4.7% |
| Standard Deviation (Population) | 4.9% | 4.6% |
Similar Demographics by 12th Grade, No Diploma
Demographics Similar to Immigrants from Uzbekistan by 12th Grade, No Diploma
In terms of 12th grade, no diploma, the demographic groups most similar to Immigrants from Uzbekistan are Immigrants from Thailand (90.1%, a difference of 0.0%), Immigrants from South America (90.1%, a difference of 0.0%), Colville (90.1%, a difference of 0.0%), Blackfeet (90.1%, a difference of 0.020%), and Immigrants from Colombia (90.1%, a difference of 0.030%).
| Demographics | Rating | Rank | 12th Grade, No Diploma |
| Immigrants | Bahamas | 3.6 /100 | #229 | Tragic 90.2% |
| Immigrants | Philippines | 2.8 /100 | #230 | Tragic 90.2% |
| Peruvians | 2.7 /100 | #231 | Tragic 90.2% |
| Blackfeet | 2.4 /100 | #232 | Tragic 90.1% |
| Immigrants | Thailand | 2.3 /100 | #233 | Tragic 90.1% |
| Immigrants | South America | 2.3 /100 | #234 | Tragic 90.1% |
| Colville | 2.3 /100 | #235 | Tragic 90.1% |
| Immigrants | Uzbekistan | 2.2 /100 | #236 | Tragic 90.1% |
| Immigrants | Colombia | 2.1 /100 | #237 | Tragic 90.1% |
| Inupiat | 2.0 /100 | #238 | Tragic 90.1% |
| Sub-Saharan Africans | 1.9 /100 | #239 | Tragic 90.1% |
| Kiowa | 1.7 /100 | #240 | Tragic 90.0% |
| Immigrants | Middle Africa | 1.7 /100 | #241 | Tragic 90.0% |
| Immigrants | Costa Rica | 1.6 /100 | #242 | Tragic 90.0% |
| Crow | 1.5 /100 | #243 | Tragic 90.0% |
Demographics Similar to Jamaicans by 12th Grade, No Diploma
In terms of 12th grade, no diploma, the demographic groups most similar to Jamaicans are Immigrants from Ghana (89.7%, a difference of 0.010%), Immigrants from Peru (89.7%, a difference of 0.020%), Immigrants from Senegal (89.7%, a difference of 0.020%), African (89.6%, a difference of 0.050%), and Immigrants from Western Africa (89.6%, a difference of 0.070%).
| Demographics | Rating | Rank | 12th Grade, No Diploma |
| Immigrants | Eritrea | 1.0 /100 | #250 | Tragic 89.9% |
| Spanish Americans | 0.9 /100 | #251 | Tragic 89.9% |
| Bahamians | 0.9 /100 | #252 | Tragic 89.9% |
| Choctaw | 0.7 /100 | #253 | Tragic 89.8% |
| Immigrants | Peru | 0.5 /100 | #254 | Tragic 89.7% |
| Immigrants | Senegal | 0.5 /100 | #255 | Tragic 89.7% |
| Immigrants | Ghana | 0.5 /100 | #256 | Tragic 89.7% |
| Jamaicans | 0.5 /100 | #257 | Tragic 89.7% |
| Africans | 0.4 /100 | #258 | Tragic 89.6% |
| Immigrants | Western Africa | 0.4 /100 | #259 | Tragic 89.6% |
| Immigrants | South Eastern Asia | 0.4 /100 | #260 | Tragic 89.6% |
| Cheyenne | 0.4 /100 | #261 | Tragic 89.6% |
| Sioux | 0.4 /100 | #262 | Tragic 89.6% |
| Immigrants | Jamaica | 0.2 /100 | #263 | Tragic 89.5% |
| Sri Lankans | 0.2 /100 | #264 | Tragic 89.4% |