Dominican vs Immigrants from Syria 3rd Grade
COMPARE
Dominican
Immigrants from Syria
3rd Grade
3rd Grade Comparison
Dominicans
Immigrants from Syria
96.4%
3RD GRADE
0.0/ 100
METRIC RATING
324th/ 347
METRIC RANK
97.5%
3RD GRADE
4.4/ 100
METRIC RATING
223rd/ 347
METRIC RANK
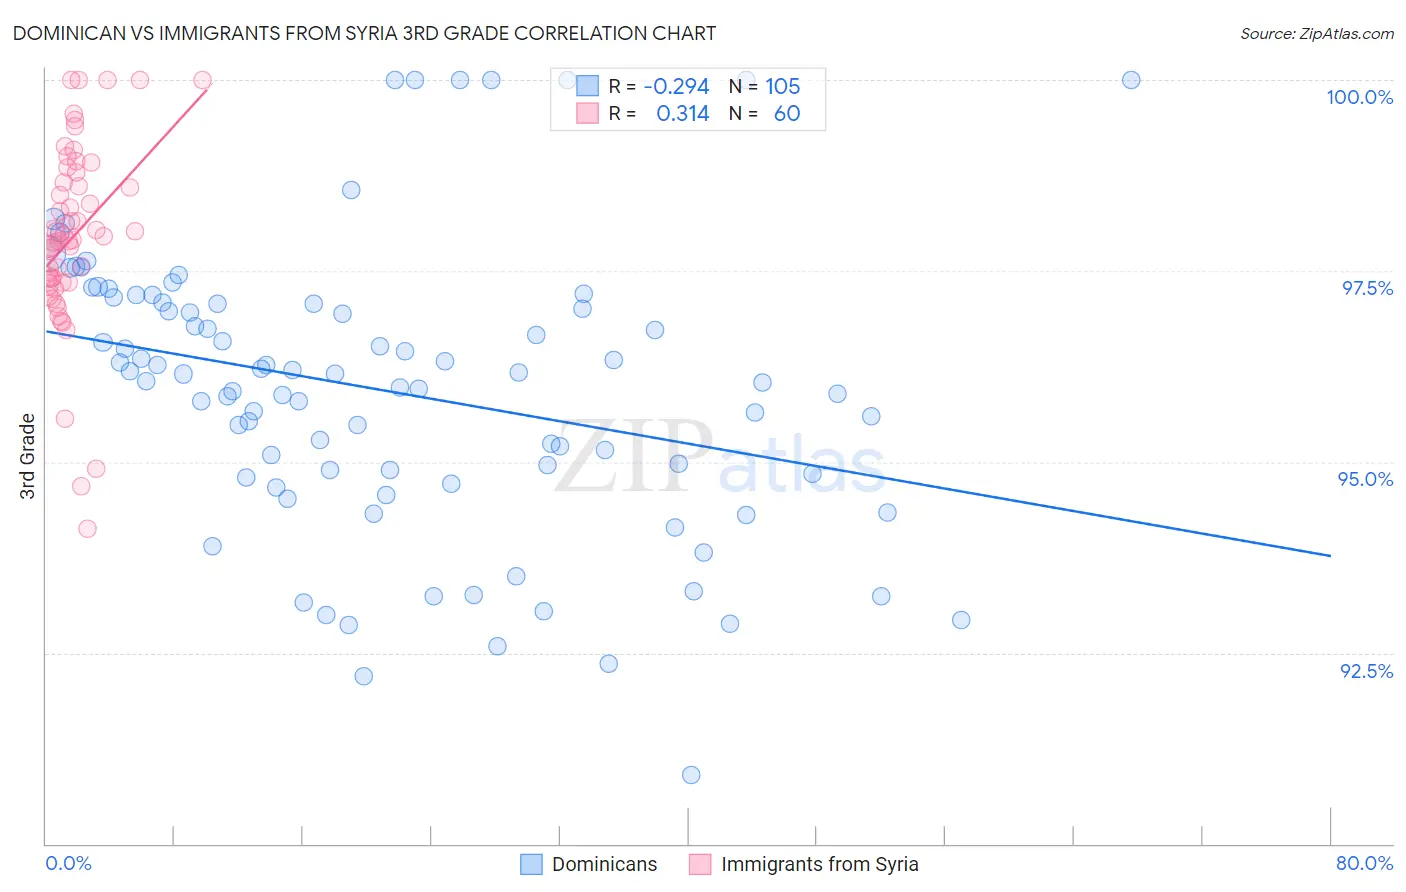
Dominican vs Immigrants from Syria 3rd Grade Correlation Chart
The statistical analysis conducted on geographies consisting of 355,142,603 people shows a weak negative correlation between the proportion of Dominicans and percentage of population with at least 3rd grade education in the United States with a correlation coefficient (R) of -0.294 and weighted average of 96.4%. Similarly, the statistical analysis conducted on geographies consisting of 174,108,374 people shows a mild positive correlation between the proportion of Immigrants from Syria and percentage of population with at least 3rd grade education in the United States with a correlation coefficient (R) of 0.314 and weighted average of 97.5%, a difference of 1.1%.
3rd Grade Correlation Summary
| Measurement | Dominican | Immigrants from Syria |
| Minimum | 90.9% | 94.1% |
| Maximum | 100.0% | 100.0% |
| Range | 9.1% | 5.9% |
| Mean | 95.9% | 97.9% |
| Median | 96.1% | 97.9% |
| Interquartile 25% (IQ1) | 94.8% | 97.3% |
| Interquartile 75% (IQ3) | 97.1% | 98.7% |
| Interquartile Range (IQR) | 2.3% | 1.4% |
| Standard Deviation (Sample) | 1.9% | 1.2% |
| Standard Deviation (Population) | 1.9% | 1.2% |
Similar Demographics by 3rd Grade
Demographics Similar to Dominicans by 3rd Grade
In terms of 3rd grade, the demographic groups most similar to Dominicans are Mexican American Indian (96.4%, a difference of 0.010%), Immigrants from Vietnam (96.4%, a difference of 0.050%), Japanese (96.4%, a difference of 0.060%), Bangladeshi (96.3%, a difference of 0.060%), and Honduran (96.5%, a difference of 0.080%).
| Demographics | Rating | Rank | 3rd Grade |
| Immigrants | Bangladesh | 0.0 /100 | #317 | Tragic 96.6% |
| Hispanics or Latinos | 0.0 /100 | #318 | Tragic 96.5% |
| Vietnamese | 0.0 /100 | #319 | Tragic 96.5% |
| Immigrants | Nicaragua | 0.0 /100 | #320 | Tragic 96.5% |
| Indonesians | 0.0 /100 | #321 | Tragic 96.5% |
| Immigrants | Belize | 0.0 /100 | #322 | Tragic 96.5% |
| Hondurans | 0.0 /100 | #323 | Tragic 96.5% |
| Dominicans | 0.0 /100 | #324 | Tragic 96.4% |
| Mexican American Indians | 0.0 /100 | #325 | Tragic 96.4% |
| Immigrants | Vietnam | 0.0 /100 | #326 | Tragic 96.4% |
| Japanese | 0.0 /100 | #327 | Tragic 96.4% |
| Bangladeshis | 0.0 /100 | #328 | Tragic 96.3% |
| Immigrants | Honduras | 0.0 /100 | #329 | Tragic 96.3% |
| Immigrants | Armenia | 0.0 /100 | #330 | Tragic 96.3% |
| Immigrants | Latin America | 0.0 /100 | #331 | Tragic 96.2% |
Demographics Similar to Immigrants from Syria by 3rd Grade
In terms of 3rd grade, the demographic groups most similar to Immigrants from Syria are Sierra Leonean (97.5%, a difference of 0.0%), Bahamian (97.5%, a difference of 0.0%), Tongan (97.5%, a difference of 0.0%), Immigrants from Panama (97.5%, a difference of 0.010%), and Immigrants from Morocco (97.5%, a difference of 0.010%).
| Demographics | Rating | Rank | 3rd Grade |
| Samoans | 6.9 /100 | #216 | Tragic 97.5% |
| South American Indians | 5.7 /100 | #217 | Tragic 97.5% |
| Immigrants | Nepal | 5.3 /100 | #218 | Tragic 97.5% |
| Immigrants | Panama | 5.2 /100 | #219 | Tragic 97.5% |
| Immigrants | Morocco | 5.0 /100 | #220 | Tragic 97.5% |
| Uruguayans | 5.0 /100 | #221 | Tragic 97.5% |
| Sierra Leoneans | 4.6 /100 | #222 | Tragic 97.5% |
| Immigrants | Syria | 4.4 /100 | #223 | Tragic 97.5% |
| Bahamians | 4.4 /100 | #224 | Tragic 97.5% |
| Tongans | 4.3 /100 | #225 | Tragic 97.5% |
| Sudanese | 4.1 /100 | #226 | Tragic 97.5% |
| Immigrants | Sudan | 3.4 /100 | #227 | Tragic 97.5% |
| Sub-Saharan Africans | 3.2 /100 | #228 | Tragic 97.5% |
| Senegalese | 3.0 /100 | #229 | Tragic 97.5% |
| Immigrants | Pakistan | 2.7 /100 | #230 | Tragic 97.5% |