Albanian vs Immigrants from Caribbean 4th Grade
COMPARE
Albanian
Immigrants from Caribbean
4th Grade
4th Grade Comparison
Albanians
Immigrants from Caribbean
97.6%
4TH GRADE
67.0/ 100
METRIC RATING
155th/ 347
METRIC RANK
96.4%
4TH GRADE
0.0/ 100
METRIC RATING
305th/ 347
METRIC RANK
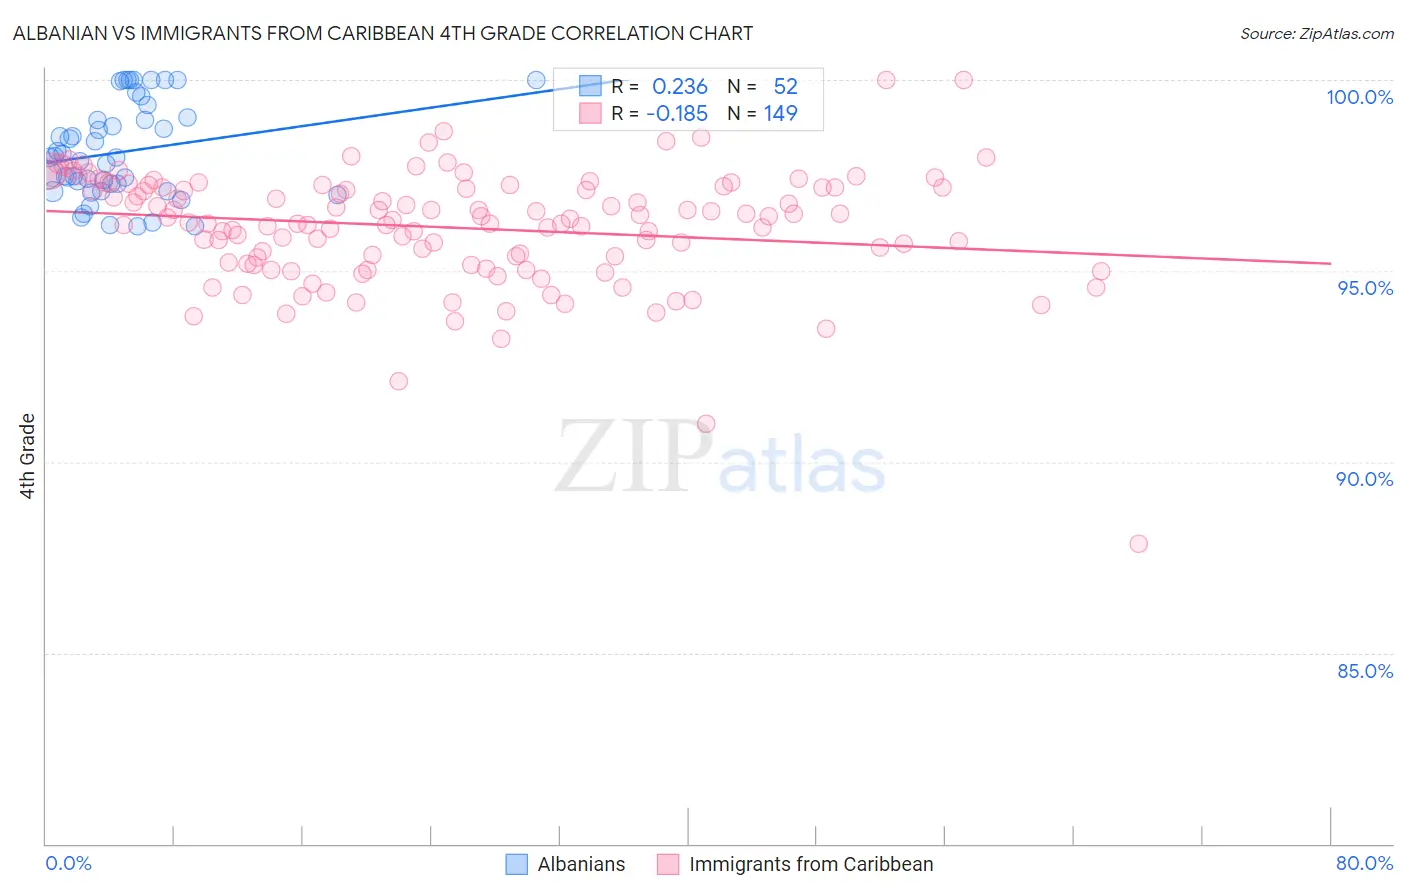
Albanian vs Immigrants from Caribbean 4th Grade Correlation Chart
The statistical analysis conducted on geographies consisting of 193,265,850 people shows a weak positive correlation between the proportion of Albanians and percentage of population with at least 4th grade education in the United States with a correlation coefficient (R) of 0.236 and weighted average of 97.6%. Similarly, the statistical analysis conducted on geographies consisting of 450,065,262 people shows a poor negative correlation between the proportion of Immigrants from Caribbean and percentage of population with at least 4th grade education in the United States with a correlation coefficient (R) of -0.185 and weighted average of 96.4%, a difference of 1.3%.
4th Grade Correlation Summary
| Measurement | Albanian | Immigrants from Caribbean |
| Minimum | 96.2% | 87.9% |
| Maximum | 100.0% | 100.0% |
| Range | 3.8% | 12.1% |
| Mean | 98.1% | 96.1% |
| Median | 98.0% | 96.3% |
| Interquartile 25% (IQ1) | 97.2% | 95.2% |
| Interquartile 75% (IQ3) | 99.0% | 97.2% |
| Interquartile Range (IQR) | 1.8% | 2.0% |
| Standard Deviation (Sample) | 1.2% | 1.5% |
| Standard Deviation (Population) | 1.2% | 1.5% |
Similar Demographics by 4th Grade
Demographics Similar to Albanians by 4th Grade
In terms of 4th grade, the demographic groups most similar to Albanians are Immigrants from Russia (97.6%, a difference of 0.0%), Immigrants from Jordan (97.6%, a difference of 0.0%), Immigrants from Bosnia and Herzegovina (97.6%, a difference of 0.0%), French American Indian (97.6%, a difference of 0.0%), and Immigrants from Italy (97.6%, a difference of 0.010%).
| Demographics | Rating | Rank | 4th Grade |
| Hopi | 80.6 /100 | #148 | Excellent 97.7% |
| Soviet Union | 77.8 /100 | #149 | Good 97.6% |
| Immigrants | Israel | 77.7 /100 | #150 | Good 97.6% |
| Alsatians | 77.2 /100 | #151 | Good 97.6% |
| Immigrants | South Central Asia | 76.2 /100 | #152 | Good 97.6% |
| Immigrants | Eastern Europe | 71.3 /100 | #153 | Good 97.6% |
| Immigrants | Russia | 67.0 /100 | #154 | Good 97.6% |
| Albanians | 67.0 /100 | #155 | Good 97.6% |
| Immigrants | Jordan | 66.9 /100 | #156 | Good 97.6% |
| Immigrants | Bosnia and Herzegovina | 66.0 /100 | #157 | Good 97.6% |
| French American Indians | 65.9 /100 | #158 | Good 97.6% |
| Immigrants | Italy | 63.7 /100 | #159 | Good 97.6% |
| Apache | 61.3 /100 | #160 | Good 97.6% |
| Marshallese | 60.8 /100 | #161 | Good 97.6% |
| Bermudans | 60.5 /100 | #162 | Good 97.6% |
Demographics Similar to Immigrants from Caribbean by 4th Grade
In terms of 4th grade, the demographic groups most similar to Immigrants from Caribbean are Sri Lankan (96.4%, a difference of 0.010%), Ecuadorian (96.4%, a difference of 0.020%), Guyanese (96.4%, a difference of 0.030%), Immigrants from Haiti (96.3%, a difference of 0.040%), and Immigrants from Laos (96.3%, a difference of 0.050%).
| Demographics | Rating | Rank | 4th Grade |
| Haitians | 0.0 /100 | #298 | Tragic 96.5% |
| Immigrants | Dominica | 0.0 /100 | #299 | Tragic 96.5% |
| Immigrants | South Eastern Asia | 0.0 /100 | #300 | Tragic 96.5% |
| Immigrants | Immigrants | 0.0 /100 | #301 | Tragic 96.5% |
| Immigrants | Cuba | 0.0 /100 | #302 | Tragic 96.4% |
| Guyanese | 0.0 /100 | #303 | Tragic 96.4% |
| Ecuadorians | 0.0 /100 | #304 | Tragic 96.4% |
| Immigrants | Caribbean | 0.0 /100 | #305 | Tragic 96.4% |
| Sri Lankans | 0.0 /100 | #306 | Tragic 96.4% |
| Immigrants | Haiti | 0.0 /100 | #307 | Tragic 96.3% |
| Immigrants | Laos | 0.0 /100 | #308 | Tragic 96.3% |
| Immigrants | Guyana | 0.0 /100 | #309 | Tragic 96.3% |
| Immigrants | Burma/Myanmar | 0.0 /100 | #310 | Tragic 96.3% |
| Immigrants | Bangladesh | 0.0 /100 | #311 | Tragic 96.2% |
| Cape Verdeans | 0.0 /100 | #312 | Tragic 96.2% |