Czech vs Hungarian High School Diploma
COMPARE
Czech
Hungarian
High School Diploma
High School Diploma Comparison
Czechs
Hungarians
91.6%
HIGH SCHOOL DIPLOMA
99.9/ 100
METRIC RATING
20th/ 347
METRIC RANK
90.8%
HIGH SCHOOL DIPLOMA
99.3/ 100
METRIC RATING
76th/ 347
METRIC RANK
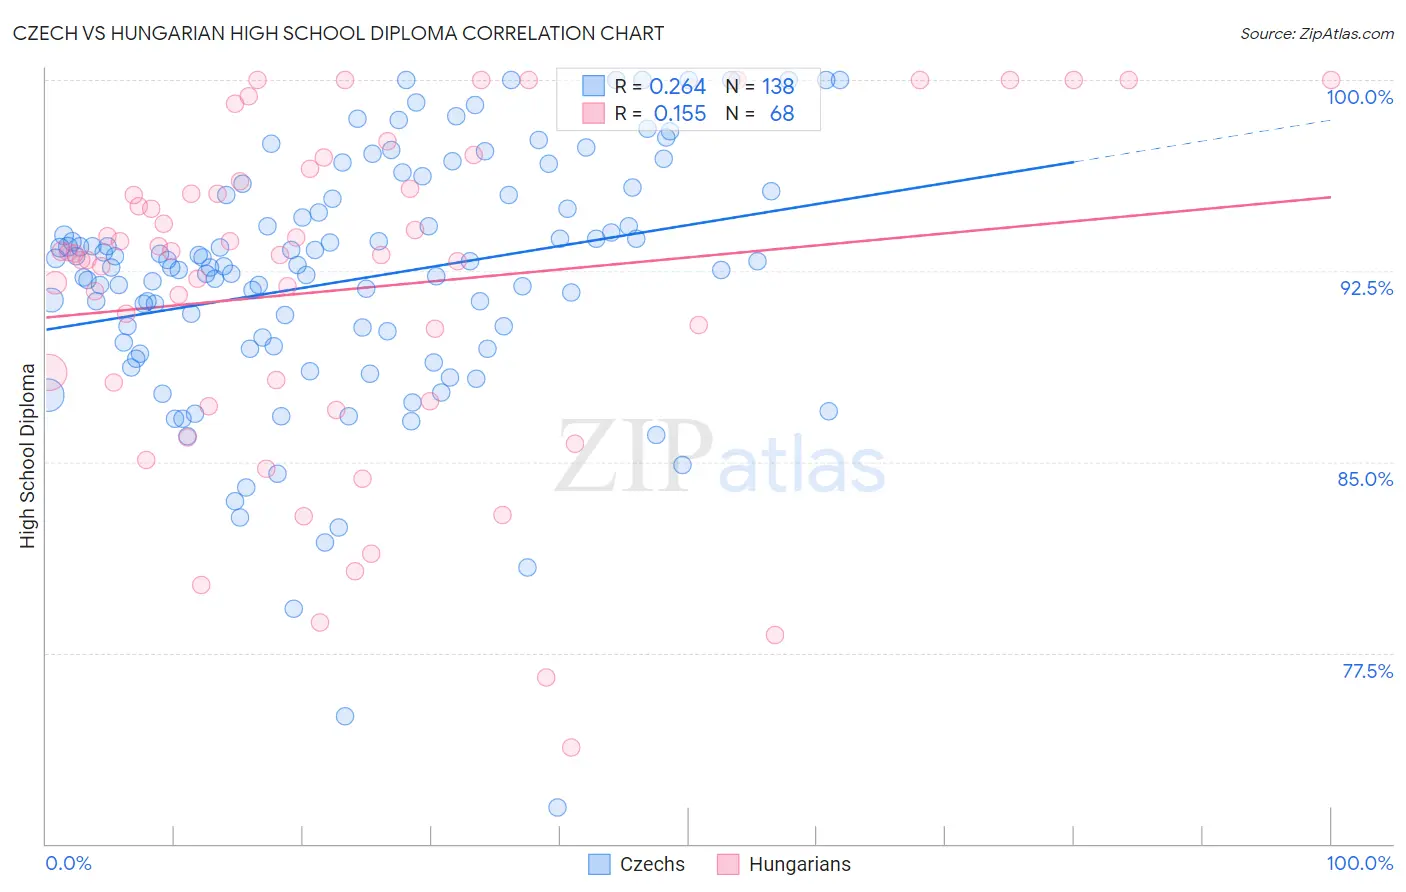
Czech vs Hungarian High School Diploma Correlation Chart
The statistical analysis conducted on geographies consisting of 484,813,791 people shows a weak positive correlation between the proportion of Czechs and percentage of population with at least high school diploma education in the United States with a correlation coefficient (R) of 0.264 and weighted average of 91.6%. Similarly, the statistical analysis conducted on geographies consisting of 486,240,766 people shows a poor positive correlation between the proportion of Hungarians and percentage of population with at least high school diploma education in the United States with a correlation coefficient (R) of 0.155 and weighted average of 90.8%, a difference of 0.83%.
High School Diploma Correlation Summary
| Measurement | Czech | Hungarian |
| Minimum | 71.4% | 73.8% |
| Maximum | 100.0% | 100.0% |
| Range | 28.6% | 26.2% |
| Mean | 92.2% | 91.8% |
| Median | 92.7% | 93.2% |
| Interquartile 25% (IQ1) | 89.5% | 87.8% |
| Interquartile 75% (IQ3) | 95.3% | 95.9% |
| Interquartile Range (IQR) | 5.8% | 8.1% |
| Standard Deviation (Sample) | 5.0% | 6.5% |
| Standard Deviation (Population) | 4.9% | 6.4% |
Similar Demographics by High School Diploma
Demographics Similar to Czechs by High School Diploma
In terms of high school diploma, the demographic groups most similar to Czechs are Filipino (91.6%, a difference of 0.010%), Estonian (91.6%, a difference of 0.020%), Maltese (91.6%, a difference of 0.030%), Scandinavian (91.5%, a difference of 0.050%), and Italian (91.5%, a difference of 0.050%).
| Demographics | Rating | Rank | High School Diploma |
| Danes | 100.0 /100 | #13 | Exceptional 91.8% |
| Bulgarians | 100.0 /100 | #14 | Exceptional 91.8% |
| Luxembourgers | 100.0 /100 | #15 | Exceptional 91.7% |
| Finns | 100.0 /100 | #16 | Exceptional 91.7% |
| Immigrants | Singapore | 99.9 /100 | #17 | Exceptional 91.7% |
| Germans | 99.9 /100 | #18 | Exceptional 91.7% |
| Maltese | 99.9 /100 | #19 | Exceptional 91.6% |
| Czechs | 99.9 /100 | #20 | Exceptional 91.6% |
| Filipinos | 99.9 /100 | #21 | Exceptional 91.6% |
| Estonians | 99.9 /100 | #22 | Exceptional 91.6% |
| Scandinavians | 99.9 /100 | #23 | Exceptional 91.5% |
| Italians | 99.9 /100 | #24 | Exceptional 91.5% |
| Thais | 99.9 /100 | #25 | Exceptional 91.5% |
| Russians | 99.9 /100 | #26 | Exceptional 91.5% |
| Cypriots | 99.9 /100 | #27 | Exceptional 91.5% |
Demographics Similar to Hungarians by High School Diploma
In terms of high school diploma, the demographic groups most similar to Hungarians are Cambodian (90.8%, a difference of 0.010%), Native Hawaiian (90.8%, a difference of 0.010%), Burmese (90.8%, a difference of 0.010%), Immigrants from Denmark (90.8%, a difference of 0.020%), and Immigrants from Czechoslovakia (90.9%, a difference of 0.030%).
| Demographics | Rating | Rank | High School Diploma |
| French Canadians | 99.5 /100 | #69 | Exceptional 90.9% |
| Immigrants | Latvia | 99.5 /100 | #70 | Exceptional 90.9% |
| Alaskan Athabascans | 99.4 /100 | #71 | Exceptional 90.9% |
| Soviet Union | 99.4 /100 | #72 | Exceptional 90.9% |
| Immigrants | South Central Asia | 99.4 /100 | #73 | Exceptional 90.9% |
| Immigrants | Czechoslovakia | 99.4 /100 | #74 | Exceptional 90.9% |
| Cambodians | 99.4 /100 | #75 | Exceptional 90.8% |
| Hungarians | 99.3 /100 | #76 | Exceptional 90.8% |
| Native Hawaiians | 99.3 /100 | #77 | Exceptional 90.8% |
| Burmese | 99.3 /100 | #78 | Exceptional 90.8% |
| Immigrants | Denmark | 99.3 /100 | #79 | Exceptional 90.8% |
| Immigrants | England | 99.3 /100 | #80 | Exceptional 90.8% |
| Immigrants | Switzerland | 99.3 /100 | #81 | Exceptional 90.8% |
| Scotch-Irish | 99.2 /100 | #82 | Exceptional 90.8% |
| Immigrants | Moldova | 99.2 /100 | #83 | Exceptional 90.7% |