Immigrants from Indonesia vs Finnish 10th Grade
COMPARE
Immigrants from Indonesia
Finnish
10th Grade
10th Grade Comparison
Immigrants from Indonesia
Finns
93.4%
10TH GRADE
20.2/ 100
METRIC RATING
205th/ 347
METRIC RANK
95.8%
10TH GRADE
100.0/ 100
METRIC RATING
9th/ 347
METRIC RANK
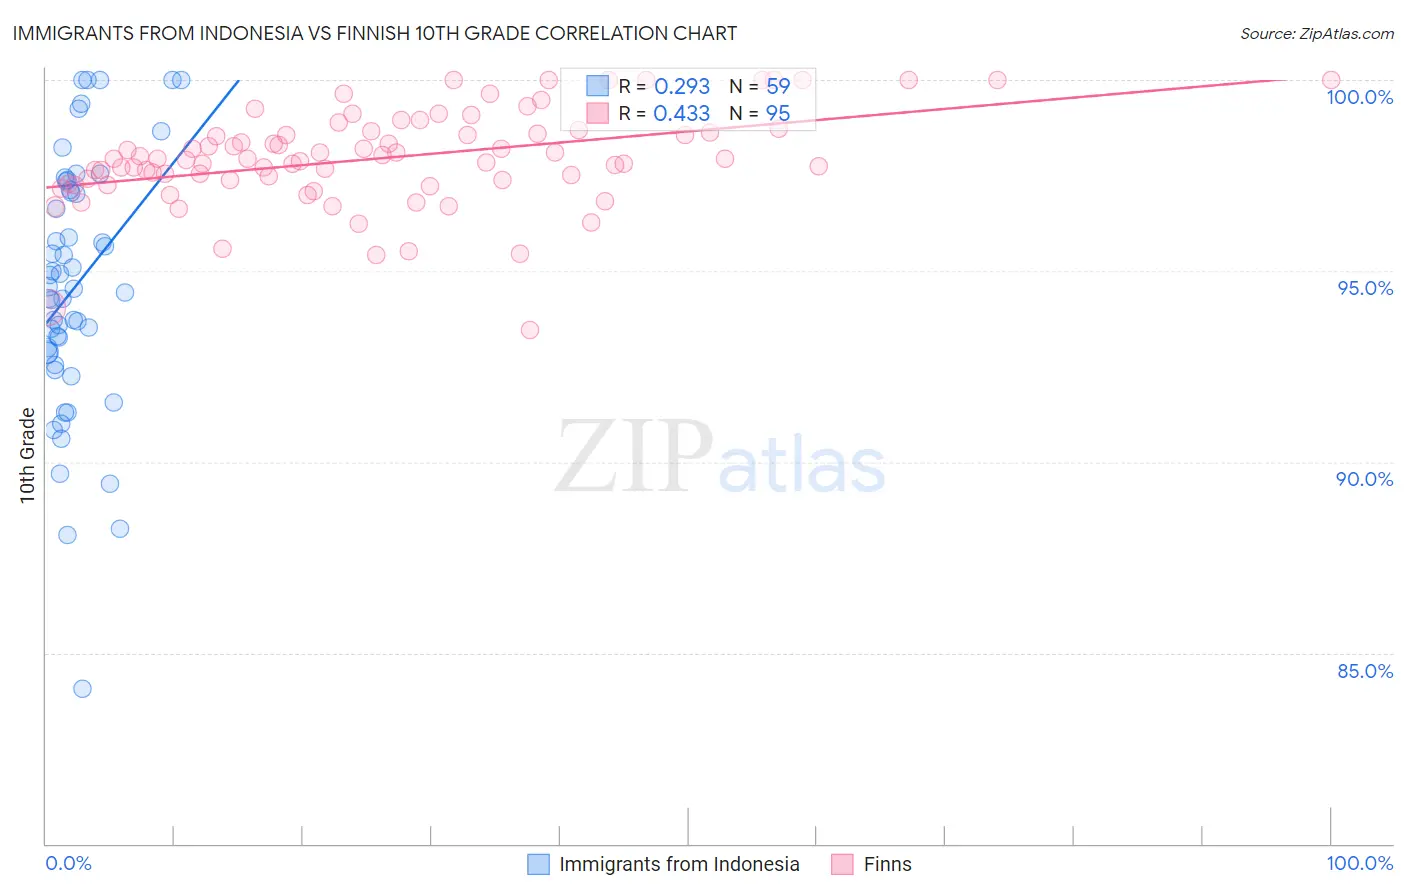
Immigrants from Indonesia vs Finnish 10th Grade Correlation Chart
The statistical analysis conducted on geographies consisting of 215,671,959 people shows a weak positive correlation between the proportion of Immigrants from Indonesia and percentage of population with at least 10th grade education in the United States with a correlation coefficient (R) of 0.293 and weighted average of 93.4%. Similarly, the statistical analysis conducted on geographies consisting of 404,676,377 people shows a moderate positive correlation between the proportion of Finns and percentage of population with at least 10th grade education in the United States with a correlation coefficient (R) of 0.433 and weighted average of 95.8%, a difference of 2.5%.
10th Grade Correlation Summary
| Measurement | Immigrants from Indonesia | Finnish |
| Minimum | 84.1% | 93.5% |
| Maximum | 100.0% | 100.0% |
| Range | 15.9% | 6.5% |
| Mean | 94.6% | 98.0% |
| Median | 94.5% | 97.9% |
| Interquartile 25% (IQ1) | 92.8% | 97.4% |
| Interquartile 75% (IQ3) | 97.1% | 98.7% |
| Interquartile Range (IQR) | 4.3% | 1.3% |
| Standard Deviation (Sample) | 3.3% | 1.3% |
| Standard Deviation (Population) | 3.3% | 1.3% |
Similar Demographics by 10th Grade
Demographics Similar to Immigrants from Indonesia by 10th Grade
In terms of 10th grade, the demographic groups most similar to Immigrants from Indonesia are Immigrants from Western Asia (93.4%, a difference of 0.0%), Ute (93.4%, a difference of 0.0%), Immigrants from Sudan (93.4%, a difference of 0.0%), Immigrants from Uganda (93.5%, a difference of 0.010%), and Samoan (93.4%, a difference of 0.010%).
| Demographics | Rating | Rank | 10th Grade |
| Immigrants | Micronesia | 23.2 /100 | #198 | Fair 93.5% |
| Asians | 23.0 /100 | #199 | Fair 93.5% |
| Hopi | 22.2 /100 | #200 | Fair 93.5% |
| Hawaiians | 21.8 /100 | #201 | Fair 93.5% |
| Immigrants | Uganda | 20.9 /100 | #202 | Fair 93.5% |
| Immigrants | Western Asia | 20.6 /100 | #203 | Fair 93.4% |
| Ute | 20.3 /100 | #204 | Fair 93.4% |
| Immigrants | Indonesia | 20.2 /100 | #205 | Fair 93.4% |
| Immigrants | Sudan | 20.0 /100 | #206 | Fair 93.4% |
| Samoans | 19.5 /100 | #207 | Poor 93.4% |
| Immigrants | Syria | 19.4 /100 | #208 | Poor 93.4% |
| Immigrants | Chile | 18.8 /100 | #209 | Poor 93.4% |
| Indians (Asian) | 17.6 /100 | #210 | Poor 93.4% |
| Cajuns | 16.9 /100 | #211 | Poor 93.4% |
| Immigrants | Zaire | 16.7 /100 | #212 | Poor 93.4% |
Demographics Similar to Finns by 10th Grade
In terms of 10th grade, the demographic groups most similar to Finns are Croatian (95.7%, a difference of 0.020%), Lithuanian (95.8%, a difference of 0.060%), Danish (95.7%, a difference of 0.060%), German (95.8%, a difference of 0.070%), and Polish (95.8%, a difference of 0.080%).
| Demographics | Rating | Rank | 10th Grade |
| Slovaks | 100.0 /100 | #2 | Exceptional 96.0% |
| Slovenes | 100.0 /100 | #3 | Exceptional 95.9% |
| Swedes | 100.0 /100 | #4 | Exceptional 95.9% |
| Carpatho Rusyns | 100.0 /100 | #5 | Exceptional 95.9% |
| Poles | 100.0 /100 | #6 | Exceptional 95.8% |
| Germans | 100.0 /100 | #7 | Exceptional 95.8% |
| Lithuanians | 100.0 /100 | #8 | Exceptional 95.8% |
| Finns | 100.0 /100 | #9 | Exceptional 95.8% |
| Croatians | 100.0 /100 | #10 | Exceptional 95.7% |
| Danes | 100.0 /100 | #11 | Exceptional 95.7% |
| Tlingit-Haida | 100.0 /100 | #12 | Exceptional 95.7% |
| English | 100.0 /100 | #13 | Exceptional 95.6% |
| Tsimshian | 100.0 /100 | #14 | Exceptional 95.6% |
| Irish | 100.0 /100 | #15 | Exceptional 95.6% |
| Scottish | 100.0 /100 | #16 | Exceptional 95.6% |