Czech vs Australian 7th Grade
COMPARE
Czech
Australian
7th Grade
7th Grade Comparison
Czechs
Australians
97.4%
7TH GRADE
100.0/ 100
METRIC RATING
30th/ 347
METRIC RANK
97.0%
7TH GRADE
99.8/ 100
METRIC RATING
54th/ 347
METRIC RANK
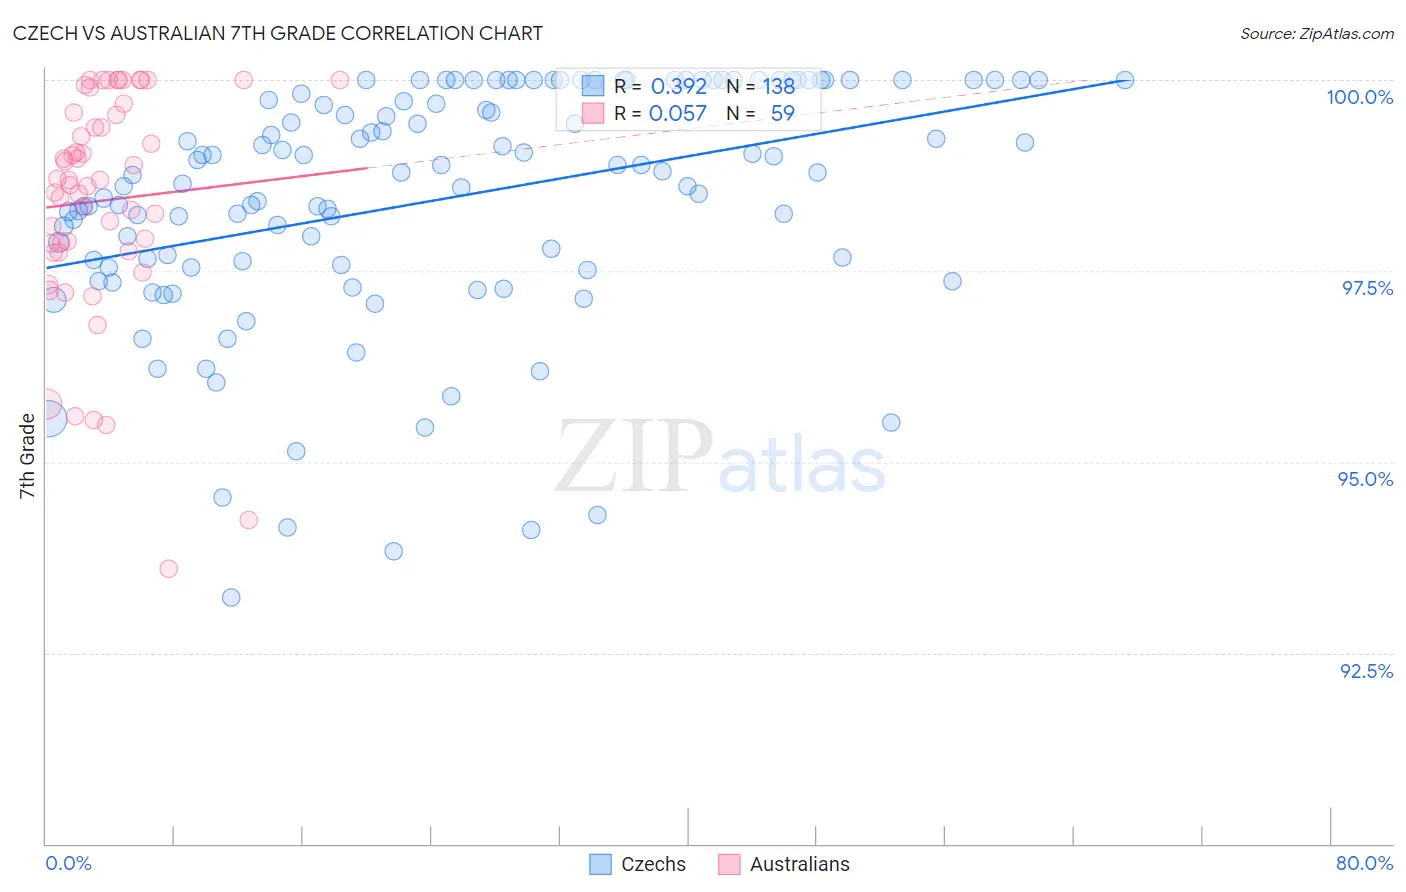
Czech vs Australian 7th Grade Correlation Chart
The statistical analysis conducted on geographies consisting of 484,805,615 people shows a mild positive correlation between the proportion of Czechs and percentage of population with at least 7th grade education in the United States with a correlation coefficient (R) of 0.392 and weighted average of 97.4%. Similarly, the statistical analysis conducted on geographies consisting of 224,153,693 people shows a slight positive correlation between the proportion of Australians and percentage of population with at least 7th grade education in the United States with a correlation coefficient (R) of 0.057 and weighted average of 97.0%, a difference of 0.39%.
7th Grade Correlation Summary
| Measurement | Czech | Australian |
| Minimum | 93.2% | 93.6% |
| Maximum | 100.0% | 100.0% |
| Range | 6.8% | 6.4% |
| Mean | 98.4% | 98.4% |
| Median | 98.8% | 98.7% |
| Interquartile 25% (IQ1) | 97.6% | 97.8% |
| Interquartile 75% (IQ3) | 100.0% | 99.6% |
| Interquartile Range (IQR) | 2.4% | 1.8% |
| Standard Deviation (Sample) | 1.6% | 1.5% |
| Standard Deviation (Population) | 1.6% | 1.5% |
Similar Demographics by 7th Grade
Demographics Similar to Czechs by 7th Grade
In terms of 7th grade, the demographic groups most similar to Czechs are Sioux (97.4%, a difference of 0.010%), Scandinavian (97.4%, a difference of 0.010%), European (97.3%, a difference of 0.020%), Italian (97.3%, a difference of 0.020%), and Scotch-Irish (97.4%, a difference of 0.030%).
| Demographics | Rating | Rank | 7th Grade |
| Croatians | 100.0 /100 | #23 | Exceptional 97.4% |
| Welsh | 100.0 /100 | #24 | Exceptional 97.4% |
| French | 100.0 /100 | #25 | Exceptional 97.4% |
| Scotch-Irish | 100.0 /100 | #26 | Exceptional 97.4% |
| Danes | 100.0 /100 | #27 | Exceptional 97.4% |
| Sioux | 100.0 /100 | #28 | Exceptional 97.4% |
| Scandinavians | 100.0 /100 | #29 | Exceptional 97.4% |
| Czechs | 100.0 /100 | #30 | Exceptional 97.4% |
| Europeans | 100.0 /100 | #31 | Exceptional 97.3% |
| Italians | 100.0 /100 | #32 | Exceptional 97.3% |
| Chippewa | 100.0 /100 | #33 | Exceptional 97.3% |
| Alaska Natives | 100.0 /100 | #34 | Exceptional 97.3% |
| Swiss | 100.0 /100 | #35 | Exceptional 97.3% |
| Hungarians | 100.0 /100 | #36 | Exceptional 97.2% |
| British | 100.0 /100 | #37 | Exceptional 97.2% |
Demographics Similar to Australians by 7th Grade
In terms of 7th grade, the demographic groups most similar to Australians are Austrian (97.0%, a difference of 0.010%), Russian (97.0%, a difference of 0.010%), Serbian (97.0%, a difference of 0.010%), American (97.0%, a difference of 0.020%), and Greek (97.0%, a difference of 0.030%).
| Demographics | Rating | Rank | 7th Grade |
| Bulgarians | 99.9 /100 | #47 | Exceptional 97.1% |
| Celtics | 99.9 /100 | #48 | Exceptional 97.1% |
| Slavs | 99.9 /100 | #49 | Exceptional 97.1% |
| Immigrants | Scotland | 99.9 /100 | #50 | Exceptional 97.1% |
| Estonians | 99.9 /100 | #51 | Exceptional 97.0% |
| Greeks | 99.9 /100 | #52 | Exceptional 97.0% |
| Austrians | 99.8 /100 | #53 | Exceptional 97.0% |
| Australians | 99.8 /100 | #54 | Exceptional 97.0% |
| Russians | 99.8 /100 | #55 | Exceptional 97.0% |
| Serbians | 99.8 /100 | #56 | Exceptional 97.0% |
| Americans | 99.8 /100 | #57 | Exceptional 97.0% |
| Whites/Caucasians | 99.8 /100 | #58 | Exceptional 97.0% |
| Macedonians | 99.8 /100 | #59 | Exceptional 97.0% |
| Immigrants | Canada | 99.8 /100 | #60 | Exceptional 96.9% |
| Creek | 99.8 /100 | #61 | Exceptional 96.9% |