Bulgarian vs Ugandan Nursery School
COMPARE
Bulgarian
Ugandan
Nursery School
Nursery School Comparison
Bulgarians
Ugandans
98.4%
NURSERY SCHOOL
99.8/ 100
METRIC RATING
58th/ 347
METRIC RANK
98.0%
NURSERY SCHOOL
56.4/ 100
METRIC RATING
164th/ 347
METRIC RANK
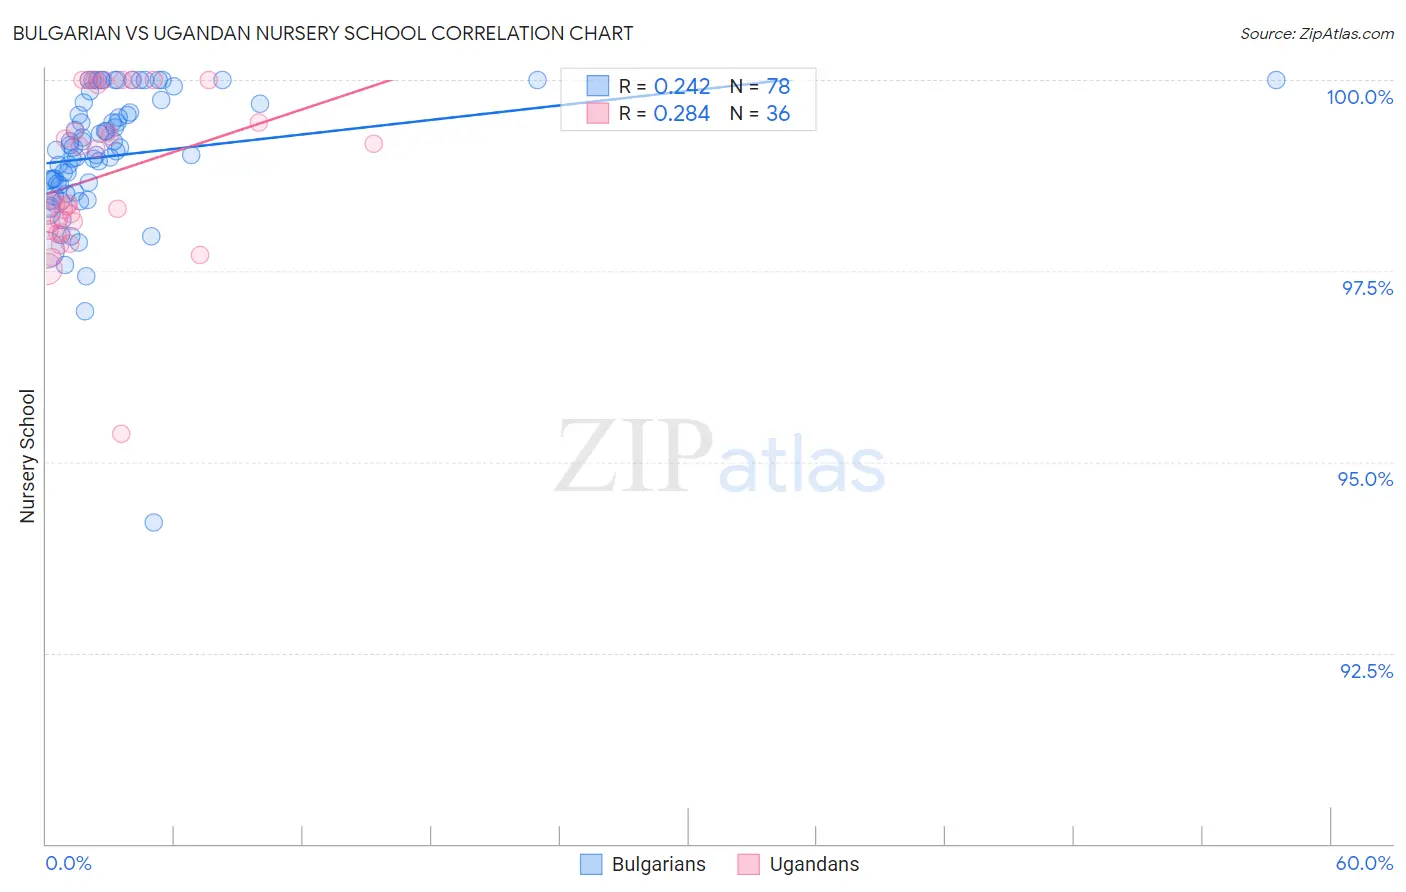
Bulgarian vs Ugandan Nursery School Correlation Chart
The statistical analysis conducted on geographies consisting of 205,633,223 people shows a weak positive correlation between the proportion of Bulgarians and percentage of population with at least nursery school education in the United States with a correlation coefficient (R) of 0.242 and weighted average of 98.4%. Similarly, the statistical analysis conducted on geographies consisting of 93,991,892 people shows a weak positive correlation between the proportion of Ugandans and percentage of population with at least nursery school education in the United States with a correlation coefficient (R) of 0.284 and weighted average of 98.0%, a difference of 0.44%.
Nursery School Correlation Summary
| Measurement | Bulgarian | Ugandan |
| Minimum | 94.2% | 95.4% |
| Maximum | 100.0% | 100.0% |
| Range | 5.8% | 4.6% |
| Mean | 99.0% | 98.7% |
| Median | 99.1% | 98.4% |
| Interquartile 25% (IQ1) | 98.6% | 98.1% |
| Interquartile 75% (IQ3) | 99.7% | 99.7% |
| Interquartile Range (IQR) | 1.1% | 1.6% |
| Standard Deviation (Sample) | 0.90% | 1.0% |
| Standard Deviation (Population) | 0.90% | 1.0% |
Similar Demographics by Nursery School
Demographics Similar to Bulgarians by Nursery School
In terms of nursery school, the demographic groups most similar to Bulgarians are American (98.4%, a difference of 0.0%), Austrian (98.4%, a difference of 0.0%), Immigrants from Canada (98.4%, a difference of 0.0%), Slavic (98.4%, a difference of 0.0%), and Pueblo (98.4%, a difference of 0.010%).
| Demographics | Rating | Rank | Nursery School |
| Estonians | 99.8 /100 | #51 | Exceptional 98.5% |
| Australians | 99.8 /100 | #52 | Exceptional 98.5% |
| Kiowa | 99.8 /100 | #53 | Exceptional 98.4% |
| Pueblo | 99.8 /100 | #54 | Exceptional 98.4% |
| Immigrants | Scotland | 99.8 /100 | #55 | Exceptional 98.4% |
| Americans | 99.8 /100 | #56 | Exceptional 98.4% |
| Austrians | 99.8 /100 | #57 | Exceptional 98.4% |
| Bulgarians | 99.8 /100 | #58 | Exceptional 98.4% |
| Immigrants | Canada | 99.8 /100 | #59 | Exceptional 98.4% |
| Slavs | 99.8 /100 | #60 | Exceptional 98.4% |
| New Zealanders | 99.7 /100 | #61 | Exceptional 98.4% |
| Creek | 99.7 /100 | #62 | Exceptional 98.4% |
| Immigrants | North America | 99.7 /100 | #63 | Exceptional 98.4% |
| Greeks | 99.7 /100 | #64 | Exceptional 98.4% |
| Maltese | 99.7 /100 | #65 | Exceptional 98.4% |
Demographics Similar to Ugandans by Nursery School
In terms of nursery school, the demographic groups most similar to Ugandans are Chilean (98.0%, a difference of 0.0%), Spanish American (98.0%, a difference of 0.0%), Immigrants from Spain (98.0%, a difference of 0.0%), Immigrants from Micronesia (98.0%, a difference of 0.0%), and Immigrants from Russia (98.0%, a difference of 0.010%).
| Demographics | Rating | Rank | Nursery School |
| Comanche | 66.0 /100 | #157 | Good 98.0% |
| Immigrants | North Macedonia | 65.7 /100 | #158 | Good 98.0% |
| French American Indians | 62.1 /100 | #159 | Good 98.0% |
| Immigrants | Russia | 59.9 /100 | #160 | Average 98.0% |
| Immigrants | Eastern Europe | 59.7 /100 | #161 | Average 98.0% |
| Brazilians | 59.4 /100 | #162 | Average 98.0% |
| Immigrants | Italy | 59.0 /100 | #163 | Average 98.0% |
| Ugandans | 56.4 /100 | #164 | Average 98.0% |
| Chileans | 56.4 /100 | #165 | Average 98.0% |
| Spanish Americans | 55.6 /100 | #166 | Average 98.0% |
| Immigrants | Spain | 55.6 /100 | #167 | Average 98.0% |
| Immigrants | Micronesia | 55.0 /100 | #168 | Average 98.0% |
| Immigrants | Korea | 53.8 /100 | #169 | Average 98.0% |
| Bermudans | 53.7 /100 | #170 | Average 98.0% |
| Immigrants | Jordan | 53.4 /100 | #171 | Average 98.0% |