Immigrants from Malaysia vs Sudanese College, 1 year or more
COMPARE
Immigrants from Malaysia
Sudanese
College, 1 year or more
College, 1 year or more Comparison
Immigrants from Malaysia
Sudanese
64.3%
COLLEGE, 1 YEAR OR MORE
99.8/ 100
METRIC RATING
51st/ 347
METRIC RANK
60.2%
COLLEGE, 1 YEAR OR MORE
73.0/ 100
METRIC RATING
154th/ 347
METRIC RANK
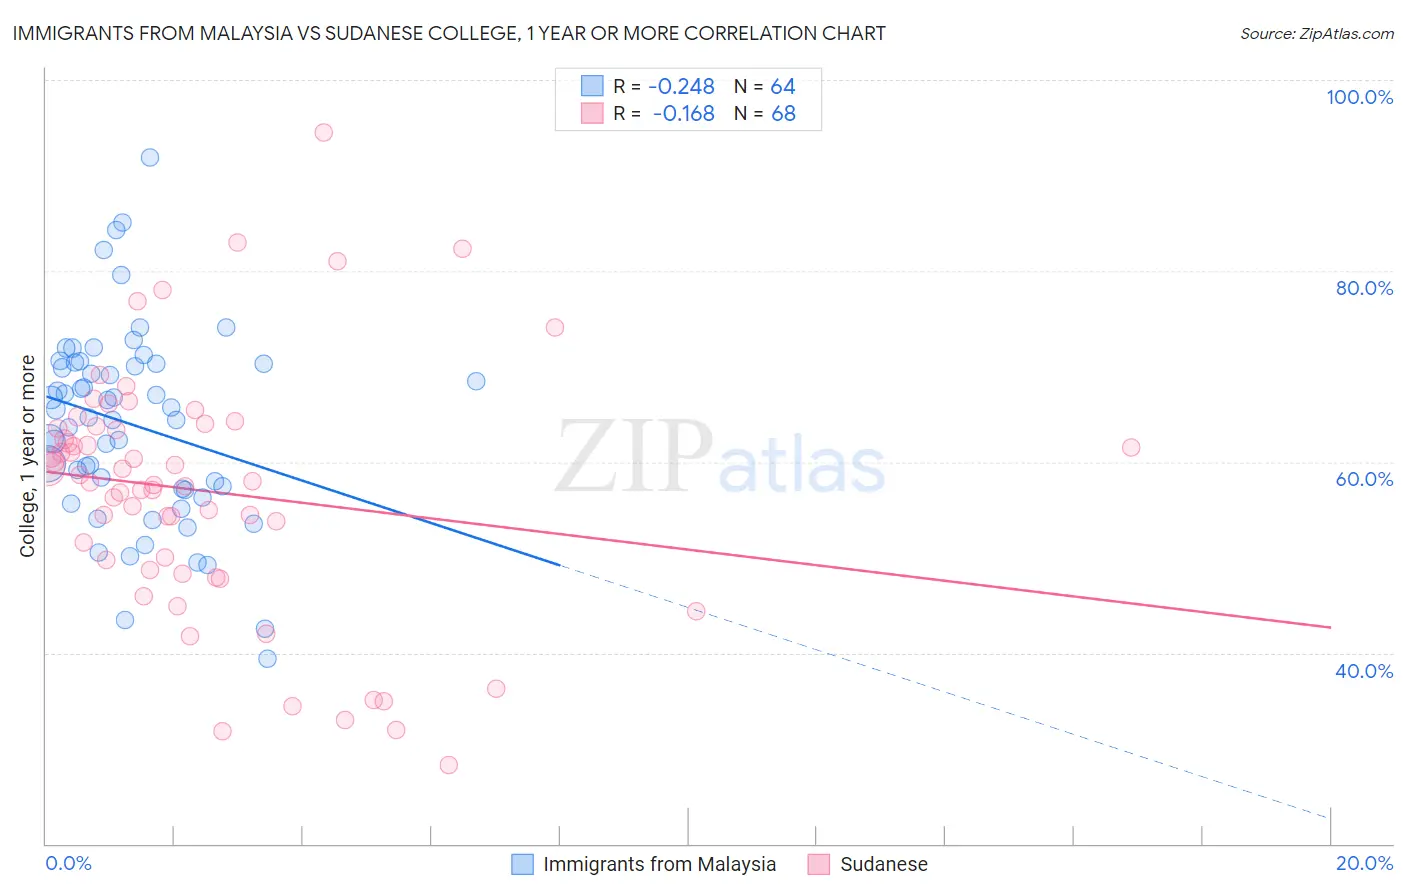
Immigrants from Malaysia vs Sudanese College, 1 year or more Correlation Chart
The statistical analysis conducted on geographies consisting of 197,973,854 people shows a weak negative correlation between the proportion of Immigrants from Malaysia and percentage of population with at least college, 1 year or more education in the United States with a correlation coefficient (R) of -0.248 and weighted average of 64.3%. Similarly, the statistical analysis conducted on geographies consisting of 110,147,806 people shows a poor negative correlation between the proportion of Sudanese and percentage of population with at least college, 1 year or more education in the United States with a correlation coefficient (R) of -0.168 and weighted average of 60.2%, a difference of 6.9%.
College, 1 year or more Correlation Summary
| Measurement | Immigrants from Malaysia | Sudanese |
| Minimum | 39.4% | 28.3% |
| Maximum | 91.9% | 94.5% |
| Range | 52.5% | 66.2% |
| Mean | 63.9% | 56.9% |
| Median | 65.1% | 57.9% |
| Interquartile 25% (IQ1) | 57.1% | 49.2% |
| Interquartile 75% (IQ3) | 70.3% | 63.6% |
| Interquartile Range (IQR) | 13.1% | 14.4% |
| Standard Deviation (Sample) | 10.2% | 13.1% |
| Standard Deviation (Population) | 10.1% | 13.0% |
Similar Demographics by College, 1 year or more
Demographics Similar to Immigrants from Malaysia by College, 1 year or more
In terms of college, 1 year or more, the demographic groups most similar to Immigrants from Malaysia are Immigrants from Austria (64.4%, a difference of 0.080%), Immigrants from Netherlands (64.2%, a difference of 0.16%), Asian (64.2%, a difference of 0.18%), Zimbabwean (64.2%, a difference of 0.21%), and Immigrants from Belarus (64.1%, a difference of 0.33%).
| Demographics | Rating | Rank | College, 1 year or more |
| Immigrants | Norway | 99.9 /100 | #44 | Exceptional 64.7% |
| Immigrants | Lithuania | 99.9 /100 | #45 | Exceptional 64.6% |
| Bhutanese | 99.9 /100 | #46 | Exceptional 64.6% |
| Australians | 99.9 /100 | #47 | Exceptional 64.6% |
| Immigrants | Bulgaria | 99.9 /100 | #48 | Exceptional 64.6% |
| New Zealanders | 99.9 /100 | #49 | Exceptional 64.6% |
| Immigrants | Austria | 99.8 /100 | #50 | Exceptional 64.4% |
| Immigrants | Malaysia | 99.8 /100 | #51 | Exceptional 64.3% |
| Immigrants | Netherlands | 99.8 /100 | #52 | Exceptional 64.2% |
| Asians | 99.8 /100 | #53 | Exceptional 64.2% |
| Zimbabweans | 99.8 /100 | #54 | Exceptional 64.2% |
| Immigrants | Belarus | 99.7 /100 | #55 | Exceptional 64.1% |
| Immigrants | Czechoslovakia | 99.7 /100 | #56 | Exceptional 64.1% |
| South Africans | 99.7 /100 | #57 | Exceptional 64.1% |
| Immigrants | Asia | 99.7 /100 | #58 | Exceptional 64.0% |
Demographics Similar to Sudanese by College, 1 year or more
In terms of college, 1 year or more, the demographic groups most similar to Sudanese are Moroccan (60.2%, a difference of 0.0%), Finnish (60.2%, a difference of 0.0%), Sierra Leonean (60.2%, a difference of 0.080%), Immigrants from Germany (60.3%, a difference of 0.22%), and Immigrants from Armenia (60.0%, a difference of 0.26%).
| Demographics | Rating | Rank | College, 1 year or more |
| Immigrants | Kenya | 79.1 /100 | #147 | Good 60.5% |
| Kenyans | 79.0 /100 | #148 | Good 60.5% |
| Brazilians | 79.0 /100 | #149 | Good 60.5% |
| Immigrants | Sudan | 77.8 /100 | #150 | Good 60.4% |
| Albanians | 77.8 /100 | #151 | Good 60.4% |
| Immigrants | Germany | 76.1 /100 | #152 | Good 60.3% |
| Sierra Leoneans | 74.1 /100 | #153 | Good 60.2% |
| Sudanese | 73.0 /100 | #154 | Good 60.2% |
| Moroccans | 72.9 /100 | #155 | Good 60.2% |
| Finns | 72.9 /100 | #156 | Good 60.2% |
| Immigrants | Armenia | 68.8 /100 | #157 | Good 60.0% |
| English | 67.2 /100 | #158 | Good 60.0% |
| Immigrants | Iraq | 67.0 /100 | #159 | Good 60.0% |
| South American Indians | 66.9 /100 | #160 | Good 60.0% |
| Somalis | 64.5 /100 | #161 | Good 59.9% |