Czechoslovakian vs Immigrants from Denmark 5th Grade
COMPARE
Czechoslovakian
Immigrants from Denmark
5th Grade
5th Grade Comparison
Czechoslovakians
Immigrants from Denmark
98.0%
5TH GRADE
99.9/ 100
METRIC RATING
45th/ 347
METRIC RANK
97.8%
5TH GRADE
98.6/ 100
METRIC RATING
94th/ 347
METRIC RANK
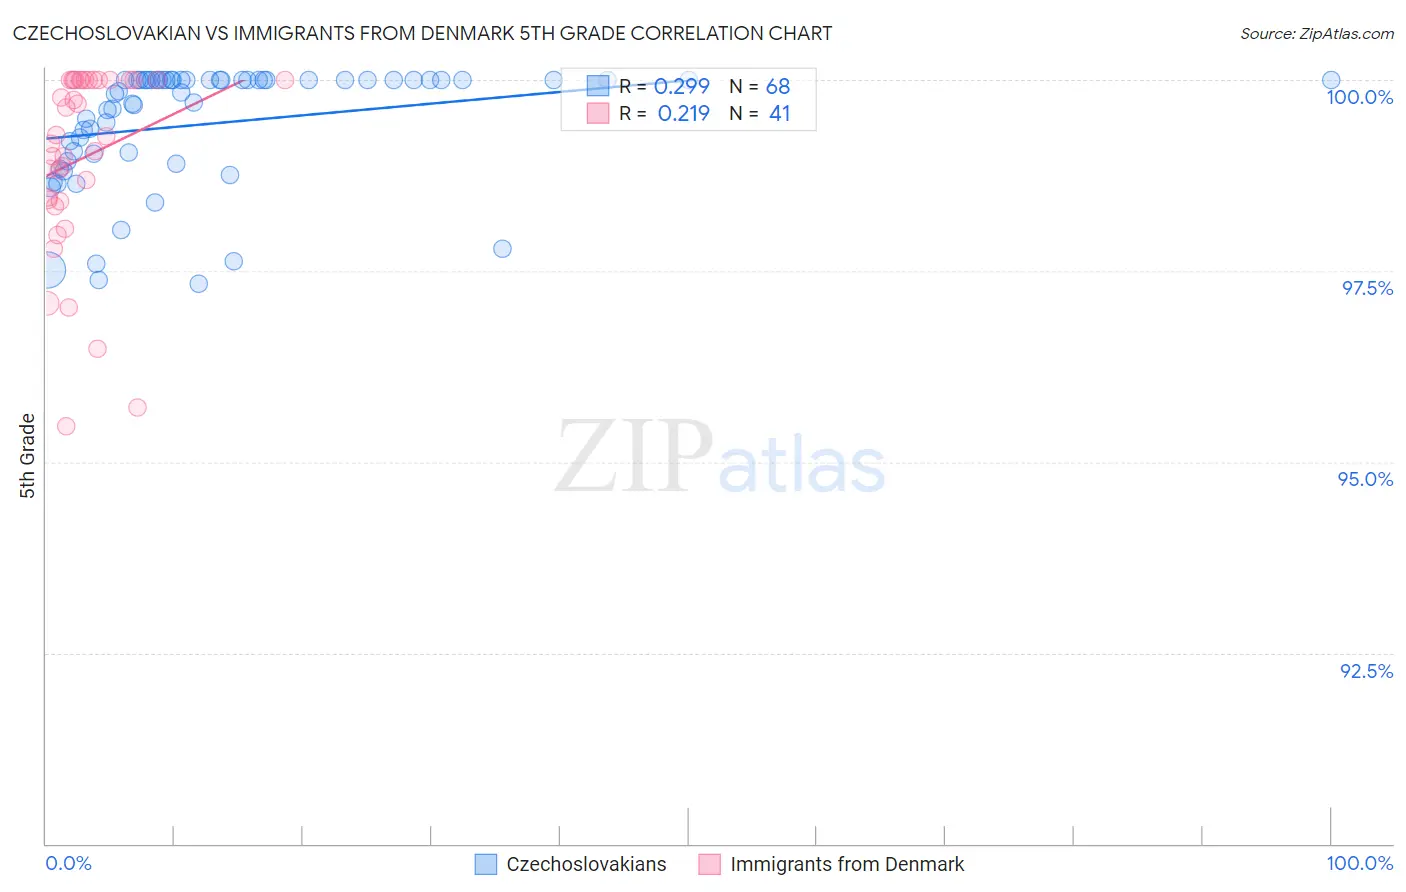
Czechoslovakian vs Immigrants from Denmark 5th Grade Correlation Chart
The statistical analysis conducted on geographies consisting of 368,657,544 people shows a weak positive correlation between the proportion of Czechoslovakians and percentage of population with at least 5th grade education in the United States with a correlation coefficient (R) of 0.299 and weighted average of 98.0%. Similarly, the statistical analysis conducted on geographies consisting of 136,430,932 people shows a weak positive correlation between the proportion of Immigrants from Denmark and percentage of population with at least 5th grade education in the United States with a correlation coefficient (R) of 0.219 and weighted average of 97.8%, a difference of 0.25%.
5th Grade Correlation Summary
| Measurement | Czechoslovakian | Immigrants from Denmark |
| Minimum | 97.3% | 95.5% |
| Maximum | 100.0% | 100.0% |
| Range | 2.7% | 4.5% |
| Mean | 99.4% | 99.0% |
| Median | 99.9% | 99.3% |
| Interquartile 25% (IQ1) | 99.0% | 98.4% |
| Interquartile 75% (IQ3) | 100.0% | 100.0% |
| Interquartile Range (IQR) | 1.0% | 1.6% |
| Standard Deviation (Sample) | 0.78% | 1.2% |
| Standard Deviation (Population) | 0.78% | 1.2% |
Similar Demographics by 5th Grade
Demographics Similar to Czechoslovakians by 5th Grade
In terms of 5th grade, the demographic groups most similar to Czechoslovakians are Arapaho (98.0%, a difference of 0.0%), Aleut (98.0%, a difference of 0.010%), Native Hawaiian (98.0%, a difference of 0.010%), Ottawa (98.0%, a difference of 0.020%), and Bulgarian (98.0%, a difference of 0.020%).
| Demographics | Rating | Rank | 5th Grade |
| Belgians | 99.9 /100 | #38 | Exceptional 98.1% |
| Luxembourgers | 99.9 /100 | #39 | Exceptional 98.1% |
| Eastern Europeans | 99.9 /100 | #40 | Exceptional 98.1% |
| Hungarians | 99.9 /100 | #41 | Exceptional 98.0% |
| Northern Europeans | 99.9 /100 | #42 | Exceptional 98.0% |
| Ottawa | 99.9 /100 | #43 | Exceptional 98.0% |
| Aleuts | 99.9 /100 | #44 | Exceptional 98.0% |
| Czechoslovakians | 99.9 /100 | #45 | Exceptional 98.0% |
| Arapaho | 99.9 /100 | #46 | Exceptional 98.0% |
| Native Hawaiians | 99.9 /100 | #47 | Exceptional 98.0% |
| Bulgarians | 99.8 /100 | #48 | Exceptional 98.0% |
| Estonians | 99.8 /100 | #49 | Exceptional 98.0% |
| Immigrants | Scotland | 99.8 /100 | #50 | Exceptional 98.0% |
| Celtics | 99.8 /100 | #51 | Exceptional 98.0% |
| Maltese | 99.8 /100 | #52 | Exceptional 98.0% |
Demographics Similar to Immigrants from Denmark by 5th Grade
In terms of 5th grade, the demographic groups most similar to Immigrants from Denmark are Delaware (97.8%, a difference of 0.0%), Romanian (97.8%, a difference of 0.0%), Immigrants from Germany (97.8%, a difference of 0.0%), Immigrants from Western Europe (97.8%, a difference of 0.010%), and Immigrants from Sweden (97.8%, a difference of 0.010%).
| Demographics | Rating | Rank | 5th Grade |
| Immigrants | Australia | 98.8 /100 | #87 | Exceptional 97.8% |
| Shoshone | 98.8 /100 | #88 | Exceptional 97.8% |
| Immigrants | South Africa | 98.8 /100 | #89 | Exceptional 97.8% |
| Immigrants | Ireland | 98.8 /100 | #90 | Exceptional 97.8% |
| Immigrants | Western Europe | 98.8 /100 | #91 | Exceptional 97.8% |
| Immigrants | Sweden | 98.7 /100 | #92 | Exceptional 97.8% |
| Delaware | 98.6 /100 | #93 | Exceptional 97.8% |
| Immigrants | Denmark | 98.6 /100 | #94 | Exceptional 97.8% |
| Romanians | 98.6 /100 | #95 | Exceptional 97.8% |
| Immigrants | Germany | 98.5 /100 | #96 | Exceptional 97.8% |
| Cree | 98.4 /100 | #97 | Exceptional 97.7% |
| Yugoslavians | 98.3 /100 | #98 | Exceptional 97.7% |
| Turks | 98.3 /100 | #99 | Exceptional 97.7% |
| Puget Sound Salish | 98.3 /100 | #100 | Exceptional 97.7% |
| South Africans | 98.3 /100 | #101 | Exceptional 97.7% |