Czechoslovakian vs Brazilian Professional Degree
COMPARE
Czechoslovakian
Brazilian
Professional Degree
Professional Degree Comparison
Czechoslovakians
Brazilians
4.2%
PROFESSIONAL DEGREE
22.4/ 100
METRIC RATING
197th/ 347
METRIC RANK
5.0%
PROFESSIONAL DEGREE
97.4/ 100
METRIC RATING
111th/ 347
METRIC RANK
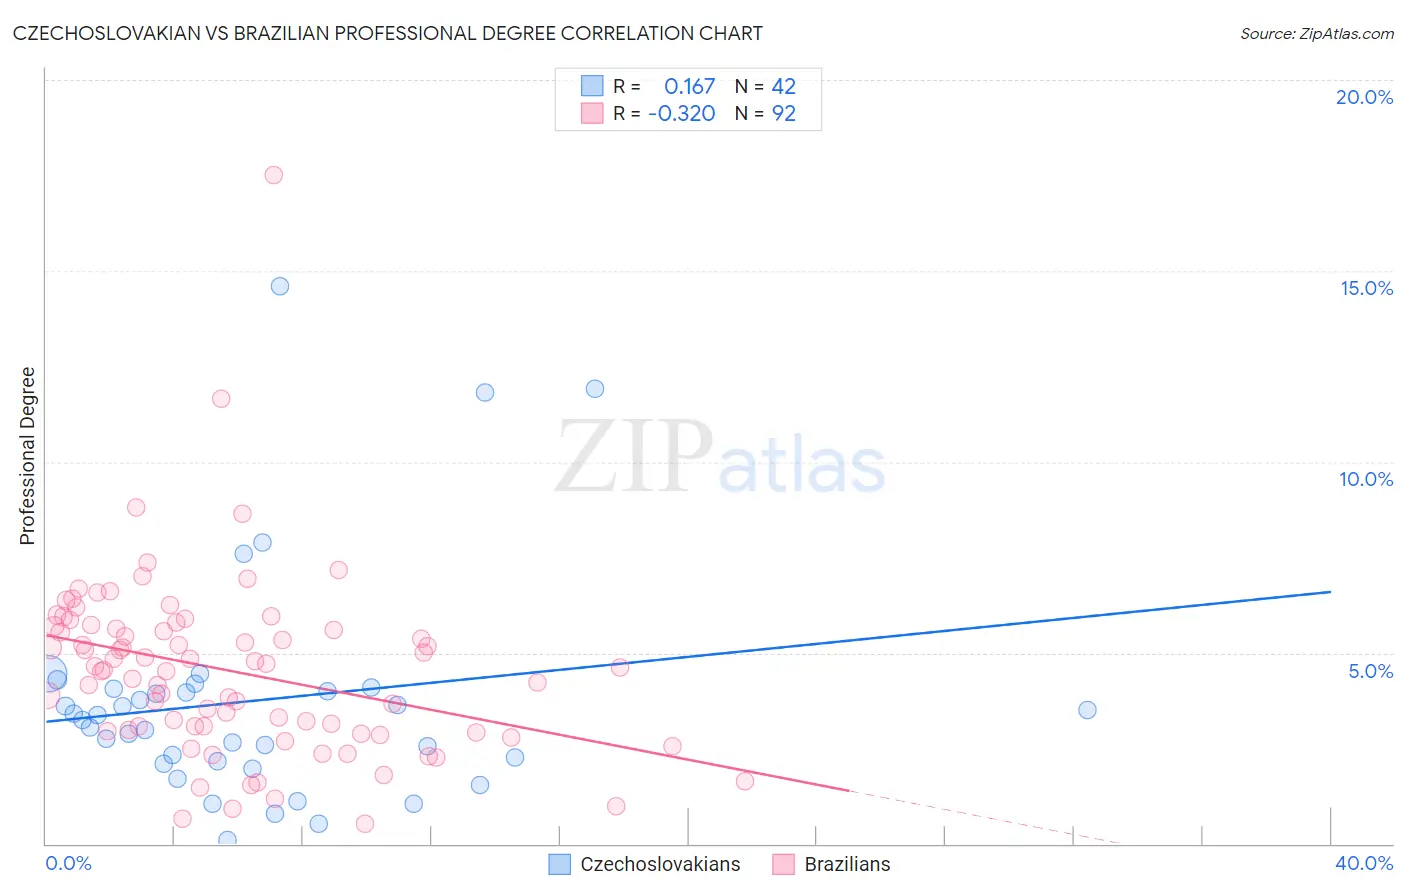
Czechoslovakian vs Brazilian Professional Degree Correlation Chart
The statistical analysis conducted on geographies consisting of 367,571,969 people shows a poor positive correlation between the proportion of Czechoslovakians and percentage of population with at least professional degree education in the United States with a correlation coefficient (R) of 0.167 and weighted average of 4.2%. Similarly, the statistical analysis conducted on geographies consisting of 323,483,336 people shows a mild negative correlation between the proportion of Brazilians and percentage of population with at least professional degree education in the United States with a correlation coefficient (R) of -0.320 and weighted average of 5.0%, a difference of 18.6%.
Professional Degree Correlation Summary
| Measurement | Czechoslovakian | Brazilian |
| Minimum | 0.10% | 0.54% |
| Maximum | 14.6% | 17.5% |
| Range | 14.5% | 17.0% |
| Mean | 3.7% | 4.5% |
| Median | 3.3% | 4.6% |
| Interquartile 25% (IQ1) | 2.2% | 3.0% |
| Interquartile 75% (IQ3) | 4.0% | 5.7% |
| Interquartile Range (IQR) | 1.9% | 2.7% |
| Standard Deviation (Sample) | 3.0% | 2.4% |
| Standard Deviation (Population) | 3.0% | 2.4% |
Similar Demographics by Professional Degree
Demographics Similar to Czechoslovakians by Professional Degree
In terms of professional degree, the demographic groups most similar to Czechoslovakians are Immigrants from Middle Africa (4.2%, a difference of 0.050%), Spanish (4.2%, a difference of 0.14%), Norwegian (4.2%, a difference of 0.42%), Nigerian (4.2%, a difference of 0.47%), and Immigrants from North Macedonia (4.2%, a difference of 0.50%).
| Demographics | Rating | Rank | Professional Degree |
| Immigrants | Poland | 29.2 /100 | #190 | Fair 4.3% |
| Sri Lankans | 29.0 /100 | #191 | Fair 4.3% |
| Ghanaians | 27.3 /100 | #192 | Fair 4.3% |
| French | 27.1 /100 | #193 | Fair 4.2% |
| Scandinavians | 25.8 /100 | #194 | Fair 4.2% |
| Nigerians | 24.6 /100 | #195 | Fair 4.2% |
| Spanish | 23.0 /100 | #196 | Fair 4.2% |
| Czechoslovakians | 22.4 /100 | #197 | Fair 4.2% |
| Immigrants | Middle Africa | 22.1 /100 | #198 | Fair 4.2% |
| Norwegians | 20.5 /100 | #199 | Fair 4.2% |
| Immigrants | North Macedonia | 20.2 /100 | #200 | Fair 4.2% |
| Finns | 18.7 /100 | #201 | Poor 4.2% |
| Immigrants | Iraq | 17.1 /100 | #202 | Poor 4.2% |
| Panamanians | 15.9 /100 | #203 | Poor 4.1% |
| Barbadians | 15.8 /100 | #204 | Poor 4.1% |
Demographics Similar to Brazilians by Professional Degree
In terms of professional degree, the demographic groups most similar to Brazilians are Taiwanese (5.0%, a difference of 0.22%), Immigrants from Pakistan (5.0%, a difference of 0.24%), Immigrants from Morocco (5.0%, a difference of 0.69%), Lebanese (5.0%, a difference of 0.74%), and Moroccan (5.0%, a difference of 0.79%).
| Demographics | Rating | Rank | Professional Degree |
| Arabs | 98.2 /100 | #104 | Exceptional 5.0% |
| Immigrants | Uganda | 98.2 /100 | #105 | Exceptional 5.0% |
| Immigrants | Ukraine | 98.2 /100 | #106 | Exceptional 5.0% |
| Maltese | 98.1 /100 | #107 | Exceptional 5.0% |
| Immigrants | Southern Europe | 98.1 /100 | #108 | Exceptional 5.0% |
| British | 98.0 /100 | #109 | Exceptional 5.0% |
| Lebanese | 98.0 /100 | #110 | Exceptional 5.0% |
| Brazilians | 97.4 /100 | #111 | Exceptional 5.0% |
| Taiwanese | 97.3 /100 | #112 | Exceptional 5.0% |
| Immigrants | Pakistan | 97.2 /100 | #113 | Exceptional 5.0% |
| Immigrants | Morocco | 96.8 /100 | #114 | Exceptional 5.0% |
| Moroccans | 96.8 /100 | #115 | Exceptional 5.0% |
| Venezuelans | 96.3 /100 | #116 | Exceptional 4.9% |
| Immigrants | Syria | 96.0 /100 | #117 | Exceptional 4.9% |
| Croatians | 96.0 /100 | #118 | Exceptional 4.9% |