Immigrants from Cameroon vs Immigrants from Indonesia 3rd Grade
COMPARE
Immigrants from Cameroon
Immigrants from Indonesia
3rd Grade
3rd Grade Comparison
Immigrants from Cameroon
Immigrants from Indonesia
97.2%
3RD GRADE
0.1/ 100
METRIC RATING
274th/ 347
METRIC RANK
97.4%
3RD GRADE
1.4/ 100
METRIC RATING
241st/ 347
METRIC RANK
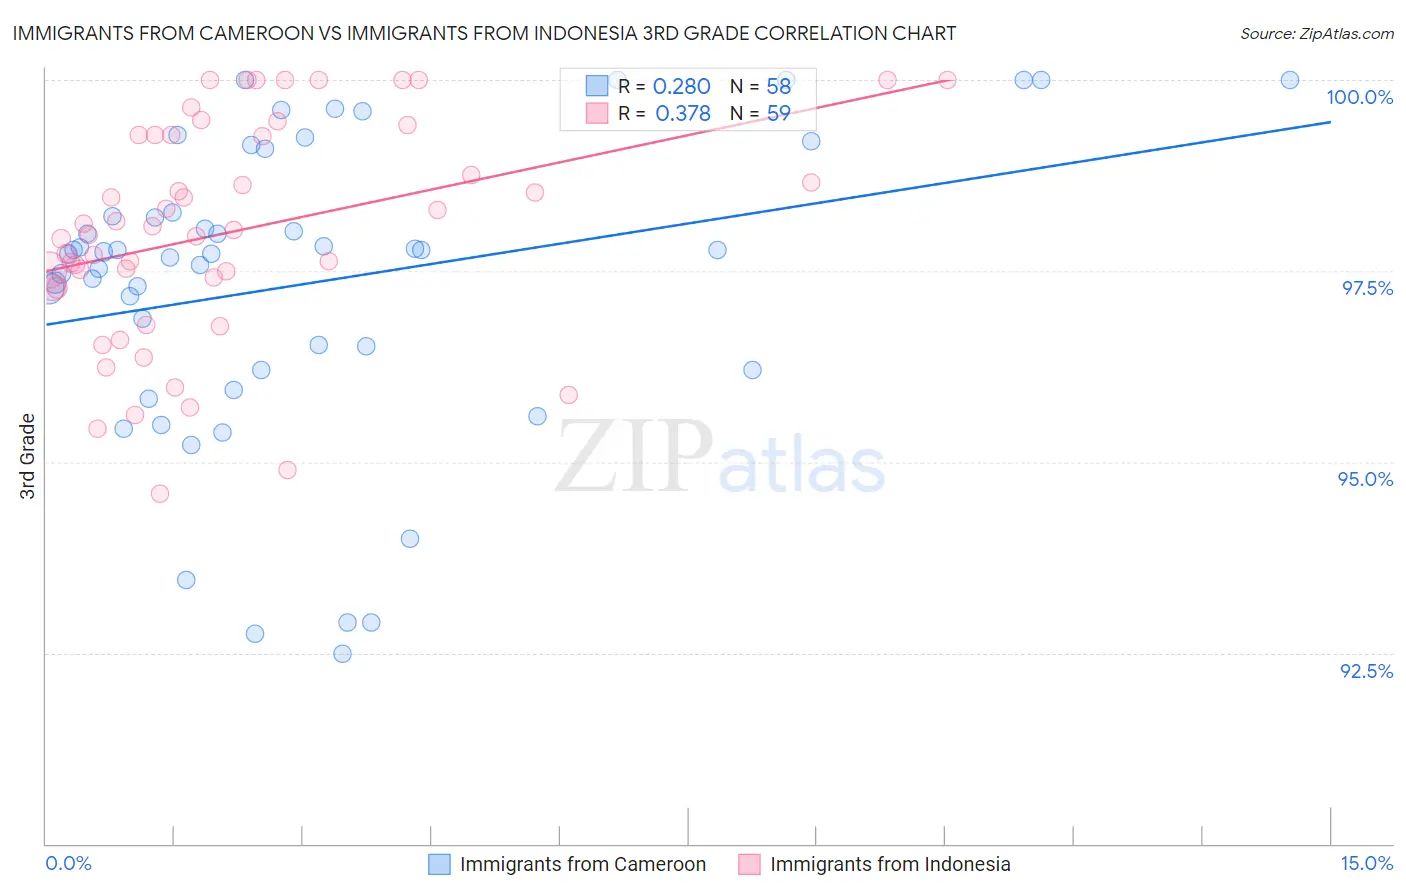
Immigrants from Cameroon vs Immigrants from Indonesia 3rd Grade Correlation Chart
The statistical analysis conducted on geographies consisting of 130,752,798 people shows a weak positive correlation between the proportion of Immigrants from Cameroon and percentage of population with at least 3rd grade education in the United States with a correlation coefficient (R) of 0.280 and weighted average of 97.2%. Similarly, the statistical analysis conducted on geographies consisting of 215,782,971 people shows a mild positive correlation between the proportion of Immigrants from Indonesia and percentage of population with at least 3rd grade education in the United States with a correlation coefficient (R) of 0.378 and weighted average of 97.4%, a difference of 0.20%.
3rd Grade Correlation Summary
| Measurement | Immigrants from Cameroon | Immigrants from Indonesia |
| Minimum | 92.5% | 94.6% |
| Maximum | 100.0% | 100.0% |
| Range | 7.5% | 5.4% |
| Mean | 97.3% | 98.0% |
| Median | 97.7% | 98.0% |
| Interquartile 25% (IQ1) | 96.2% | 97.3% |
| Interquartile 75% (IQ3) | 98.3% | 99.3% |
| Interquartile Range (IQR) | 2.1% | 2.0% |
| Standard Deviation (Sample) | 2.0% | 1.4% |
| Standard Deviation (Population) | 1.9% | 1.4% |
Similar Demographics by 3rd Grade
Demographics Similar to Immigrants from Cameroon by 3rd Grade
In terms of 3rd grade, the demographic groups most similar to Immigrants from Cameroon are Immigrants from China (97.2%, a difference of 0.010%), Puerto Rican (97.2%, a difference of 0.010%), Ghanaian (97.2%, a difference of 0.010%), Immigrants from Peru (97.2%, a difference of 0.010%), and Immigrants from Uzbekistan (97.2%, a difference of 0.020%).
| Demographics | Rating | Rank | 3rd Grade |
| Immigrants | Nigeria | 0.3 /100 | #267 | Tragic 97.3% |
| Cubans | 0.2 /100 | #268 | Tragic 97.3% |
| Fijians | 0.2 /100 | #269 | Tragic 97.3% |
| Immigrants | China | 0.2 /100 | #270 | Tragic 97.2% |
| Puerto Ricans | 0.2 /100 | #271 | Tragic 97.2% |
| Ghanaians | 0.1 /100 | #272 | Tragic 97.2% |
| Immigrants | Peru | 0.1 /100 | #273 | Tragic 97.2% |
| Immigrants | Cameroon | 0.1 /100 | #274 | Tragic 97.2% |
| Immigrants | Uzbekistan | 0.1 /100 | #275 | Tragic 97.2% |
| Immigrants | Bolivia | 0.1 /100 | #276 | Tragic 97.2% |
| Trinidadians and Tobagonians | 0.1 /100 | #277 | Tragic 97.2% |
| Immigrants | Western Africa | 0.1 /100 | #278 | Tragic 97.2% |
| Immigrants | Philippines | 0.1 /100 | #279 | Tragic 97.2% |
| Immigrants | Ghana | 0.1 /100 | #280 | Tragic 97.2% |
| Barbadians | 0.1 /100 | #281 | Tragic 97.2% |
Demographics Similar to Immigrants from Indonesia by 3rd Grade
In terms of 3rd grade, the demographic groups most similar to Immigrants from Indonesia are U.S. Virgin Islander (97.4%, a difference of 0.0%), Korean (97.4%, a difference of 0.0%), Nigerian (97.4%, a difference of 0.010%), Indian (Asian) (97.4%, a difference of 0.010%), and Immigrants from Iraq (97.4%, a difference of 0.020%).
| Demographics | Rating | Rank | 3rd Grade |
| Immigrants | Eastern Asia | 1.9 /100 | #234 | Tragic 97.4% |
| Immigrants | Iraq | 1.8 /100 | #235 | Tragic 97.4% |
| Liberians | 1.8 /100 | #236 | Tragic 97.4% |
| Colombians | 1.8 /100 | #237 | Tragic 97.4% |
| Immigrants | Uruguay | 1.7 /100 | #238 | Tragic 97.4% |
| Nigerians | 1.6 /100 | #239 | Tragic 97.4% |
| U.S. Virgin Islanders | 1.4 /100 | #240 | Tragic 97.4% |
| Immigrants | Indonesia | 1.4 /100 | #241 | Tragic 97.4% |
| Koreans | 1.3 /100 | #242 | Tragic 97.4% |
| Indians (Asian) | 1.3 /100 | #243 | Tragic 97.4% |
| Asians | 1.1 /100 | #244 | Tragic 97.4% |
| Ethiopians | 1.1 /100 | #245 | Tragic 97.4% |
| Immigrants | Senegal | 1.0 /100 | #246 | Tragic 97.4% |
| Assyrians/Chaldeans/Syriacs | 1.0 /100 | #247 | Tragic 97.4% |
| Immigrants | Eastern Africa | 0.9 /100 | #248 | Tragic 97.4% |