Croatian vs South American Professional Degree
COMPARE
Croatian
South American
Professional Degree
Professional Degree Comparison
Croatians
South Americans
4.9%
PROFESSIONAL DEGREE
96.0/ 100
METRIC RATING
118th/ 347
METRIC RANK
4.7%
PROFESSIONAL DEGREE
85.6/ 100
METRIC RATING
139th/ 347
METRIC RANK
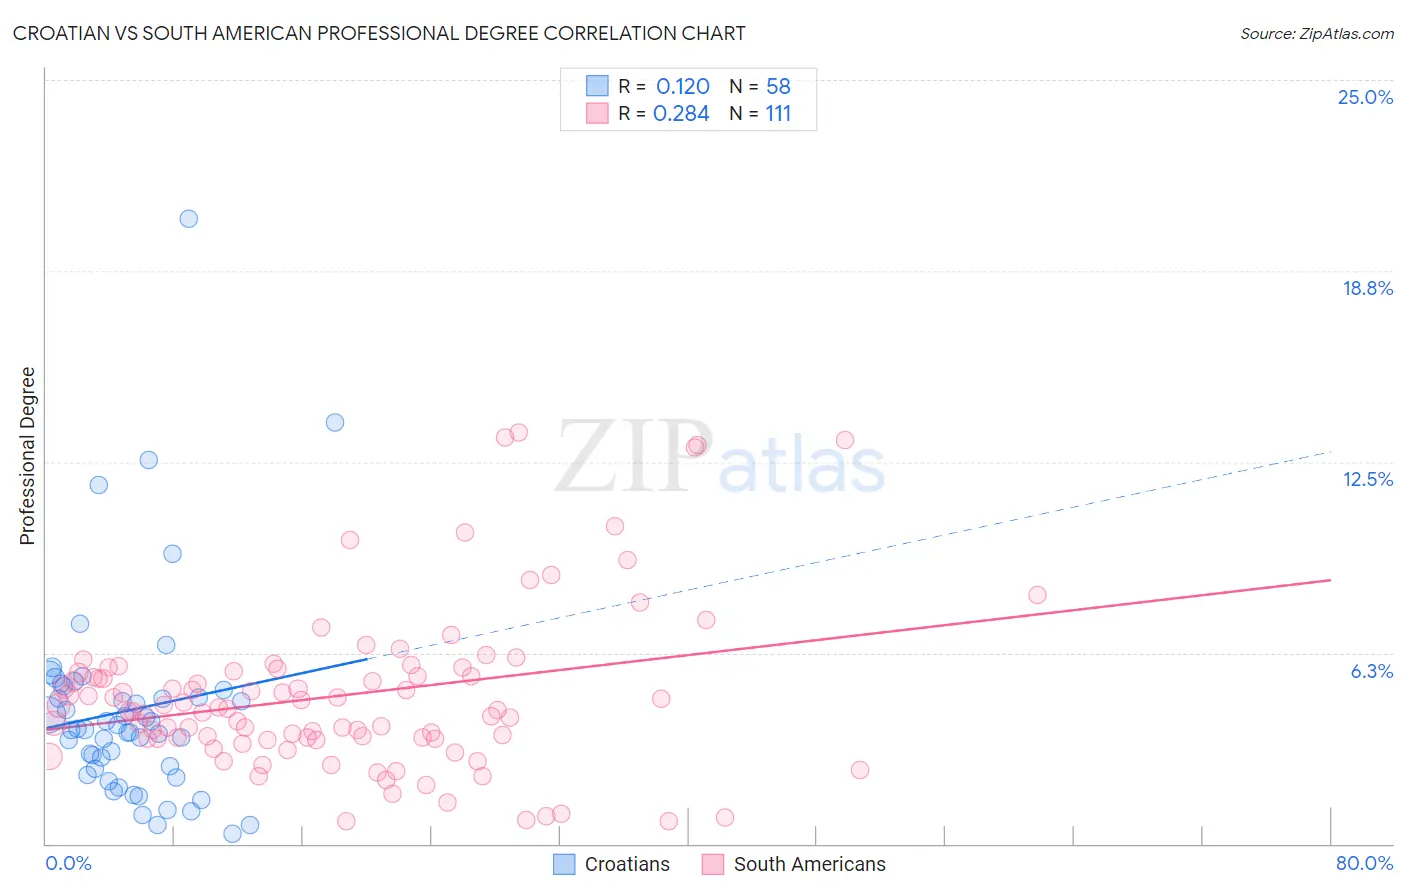
Croatian vs South American Professional Degree Correlation Chart
The statistical analysis conducted on geographies consisting of 374,896,784 people shows a poor positive correlation between the proportion of Croatians and percentage of population with at least professional degree education in the United States with a correlation coefficient (R) of 0.120 and weighted average of 4.9%. Similarly, the statistical analysis conducted on geographies consisting of 492,254,354 people shows a weak positive correlation between the proportion of South Americans and percentage of population with at least professional degree education in the United States with a correlation coefficient (R) of 0.284 and weighted average of 4.7%, a difference of 4.8%.
Professional Degree Correlation Summary
| Measurement | Croatian | South American |
| Minimum | 0.32% | 0.74% |
| Maximum | 20.4% | 13.5% |
| Range | 20.1% | 12.7% |
| Mean | 4.4% | 4.9% |
| Median | 3.8% | 4.4% |
| Interquartile 25% (IQ1) | 2.4% | 3.4% |
| Interquartile 75% (IQ3) | 5.0% | 5.6% |
| Interquartile Range (IQR) | 2.6% | 2.2% |
| Standard Deviation (Sample) | 3.4% | 2.7% |
| Standard Deviation (Population) | 3.4% | 2.7% |
Similar Demographics by Professional Degree
Demographics Similar to Croatians by Professional Degree
In terms of professional degree, the demographic groups most similar to Croatians are Immigrants from Syria (4.9%, a difference of 0.0%), Venezuelan (4.9%, a difference of 0.21%), Immigrants from Sudan (4.9%, a difference of 0.54%), Albanian (4.9%, a difference of 0.55%), and Moroccan (5.0%, a difference of 0.68%).
| Demographics | Rating | Rank | Professional Degree |
| Brazilians | 97.4 /100 | #111 | Exceptional 5.0% |
| Taiwanese | 97.3 /100 | #112 | Exceptional 5.0% |
| Immigrants | Pakistan | 97.2 /100 | #113 | Exceptional 5.0% |
| Immigrants | Morocco | 96.8 /100 | #114 | Exceptional 5.0% |
| Moroccans | 96.8 /100 | #115 | Exceptional 5.0% |
| Venezuelans | 96.3 /100 | #116 | Exceptional 4.9% |
| Immigrants | Syria | 96.0 /100 | #117 | Exceptional 4.9% |
| Croatians | 96.0 /100 | #118 | Exceptional 4.9% |
| Immigrants | Sudan | 95.4 /100 | #119 | Exceptional 4.9% |
| Albanians | 95.3 /100 | #120 | Exceptional 4.9% |
| Immigrants | Moldova | 94.8 /100 | #121 | Exceptional 4.9% |
| Immigrants | Germany | 94.1 /100 | #122 | Exceptional 4.9% |
| Immigrants | Venezuela | 93.8 /100 | #123 | Exceptional 4.8% |
| Immigrants | Eritrea | 93.5 /100 | #124 | Exceptional 4.8% |
| Immigrants | Albania | 93.3 /100 | #125 | Exceptional 4.8% |
Demographics Similar to South Americans by Professional Degree
In terms of professional degree, the demographic groups most similar to South Americans are Canadian (4.7%, a difference of 0.34%), Basque (4.6%, a difference of 0.96%), Afghan (4.7%, a difference of 0.99%), Jordanian (4.7%, a difference of 1.0%), and Immigrants from Jordan (4.7%, a difference of 1.1%).
| Demographics | Rating | Rank | Professional Degree |
| Pakistanis | 90.9 /100 | #132 | Exceptional 4.8% |
| Italians | 90.2 /100 | #133 | Exceptional 4.8% |
| South American Indians | 89.9 /100 | #134 | Excellent 4.8% |
| Macedonians | 89.8 /100 | #135 | Excellent 4.8% |
| Immigrants | Jordan | 89.0 /100 | #136 | Excellent 4.7% |
| Jordanians | 88.9 /100 | #137 | Excellent 4.7% |
| Afghans | 88.8 /100 | #138 | Excellent 4.7% |
| South Americans | 85.6 /100 | #139 | Excellent 4.7% |
| Canadians | 84.4 /100 | #140 | Excellent 4.7% |
| Basques | 81.8 /100 | #141 | Excellent 4.6% |
| Sudanese | 81.3 /100 | #142 | Excellent 4.6% |
| Hungarians | 80.8 /100 | #143 | Excellent 4.6% |
| Immigrants | South America | 80.5 /100 | #144 | Excellent 4.6% |
| Uruguayans | 80.2 /100 | #145 | Excellent 4.6% |
| Luxembourgers | 78.7 /100 | #146 | Good 4.6% |