Immigrants from Senegal vs Pakistani 11th Grade
COMPARE
Immigrants from Senegal
Pakistani
11th Grade
11th Grade Comparison
Immigrants from Senegal
Pakistanis
91.4%
11TH GRADE
0.7/ 100
METRIC RATING
256th/ 347
METRIC RANK
92.8%
11TH GRADE
79.6/ 100
METRIC RATING
145th/ 347
METRIC RANK
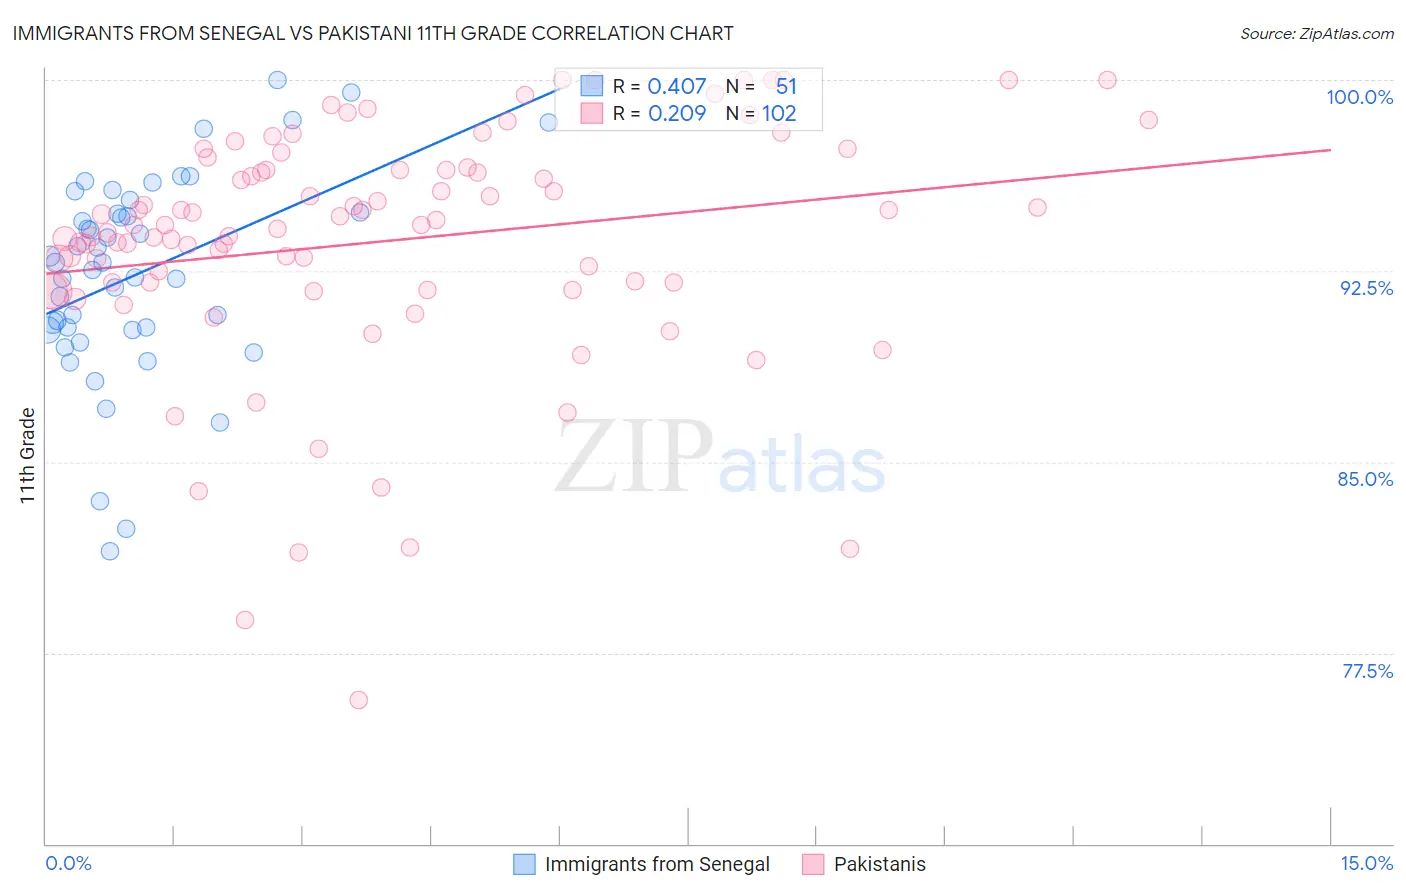
Immigrants from Senegal vs Pakistani 11th Grade Correlation Chart
The statistical analysis conducted on geographies consisting of 90,129,421 people shows a moderate positive correlation between the proportion of Immigrants from Senegal and percentage of population with at least 11th grade education in the United States with a correlation coefficient (R) of 0.407 and weighted average of 91.4%. Similarly, the statistical analysis conducted on geographies consisting of 335,356,437 people shows a weak positive correlation between the proportion of Pakistanis and percentage of population with at least 11th grade education in the United States with a correlation coefficient (R) of 0.209 and weighted average of 92.8%, a difference of 1.6%.
11th Grade Correlation Summary
| Measurement | Immigrants from Senegal | Pakistani |
| Minimum | 81.5% | 75.6% |
| Maximum | 100.0% | 100.0% |
| Range | 18.5% | 24.4% |
| Mean | 92.4% | 93.7% |
| Median | 92.8% | 94.3% |
| Interquartile 25% (IQ1) | 90.2% | 92.0% |
| Interquartile 75% (IQ3) | 94.8% | 96.5% |
| Interquartile Range (IQR) | 4.6% | 4.4% |
| Standard Deviation (Sample) | 4.0% | 4.7% |
| Standard Deviation (Population) | 4.0% | 4.7% |
Similar Demographics by 11th Grade
Demographics Similar to Immigrants from Senegal by 11th Grade
In terms of 11th grade, the demographic groups most similar to Immigrants from Senegal are Immigrants from Eritrea (91.4%, a difference of 0.010%), Black/African American (91.4%, a difference of 0.010%), Cajun (91.4%, a difference of 0.010%), Immigrants from South America (91.4%, a difference of 0.030%), and Immigrants from Colombia (91.4%, a difference of 0.030%).
| Demographics | Rating | Rank | 11th Grade |
| Peruvians | 1.0 /100 | #249 | Tragic 91.5% |
| Ghanaians | 0.9 /100 | #250 | Tragic 91.5% |
| Immigrants | Costa Rica | 0.9 /100 | #251 | Tragic 91.4% |
| Immigrants | Nigeria | 0.8 /100 | #252 | Tragic 91.4% |
| Immigrants | South America | 0.8 /100 | #253 | Tragic 91.4% |
| Immigrants | Eritrea | 0.7 /100 | #254 | Tragic 91.4% |
| Blacks/African Americans | 0.7 /100 | #255 | Tragic 91.4% |
| Immigrants | Senegal | 0.7 /100 | #256 | Tragic 91.4% |
| Cajuns | 0.7 /100 | #257 | Tragic 91.4% |
| Immigrants | Colombia | 0.6 /100 | #258 | Tragic 91.4% |
| Jamaicans | 0.6 /100 | #259 | Tragic 91.4% |
| Spanish Americans | 0.6 /100 | #260 | Tragic 91.4% |
| Taiwanese | 0.6 /100 | #261 | Tragic 91.3% |
| Immigrants | Uruguay | 0.5 /100 | #262 | Tragic 91.3% |
| Immigrants | Ghana | 0.3 /100 | #263 | Tragic 91.2% |
Demographics Similar to Pakistanis by 11th Grade
In terms of 11th grade, the demographic groups most similar to Pakistanis are Assyrian/Chaldean/Syriac (92.8%, a difference of 0.010%), Iroquois (92.8%, a difference of 0.010%), Immigrants from Kenya (92.8%, a difference of 0.010%), Hmong (92.8%, a difference of 0.020%), and Immigrants from Poland (92.8%, a difference of 0.020%).
| Demographics | Rating | Rank | 11th Grade |
| Immigrants | Brazil | 85.1 /100 | #138 | Excellent 92.9% |
| Crow | 84.1 /100 | #139 | Excellent 92.9% |
| Venezuelans | 83.4 /100 | #140 | Excellent 92.9% |
| Chileans | 83.0 /100 | #141 | Excellent 92.9% |
| Kenyans | 82.0 /100 | #142 | Excellent 92.9% |
| Ugandans | 81.4 /100 | #143 | Excellent 92.9% |
| Assyrians/Chaldeans/Syriacs | 80.5 /100 | #144 | Excellent 92.8% |
| Pakistanis | 79.6 /100 | #145 | Good 92.8% |
| Iroquois | 79.1 /100 | #146 | Good 92.8% |
| Immigrants | Kenya | 78.7 /100 | #147 | Good 92.8% |
| Hmong | 78.6 /100 | #148 | Good 92.8% |
| Immigrants | Poland | 78.5 /100 | #149 | Good 92.8% |
| Immigrants | Egypt | 77.5 /100 | #150 | Good 92.8% |
| Potawatomi | 74.3 /100 | #151 | Good 92.8% |
| Iraqis | 74.2 /100 | #152 | Good 92.8% |