Creek vs Immigrants from Caribbean Unemployment Among Women with Children Under 18 years
COMPARE
Creek
Immigrants from Caribbean
Unemployment Among Women with Children Under 18 years
Unemployment Among Women with Children Under 18 years Comparison
Creek
Immigrants from Caribbean
5.8%
UNEMPLOYMENT AMONG WOMEN WITH CHILDREN UNDER 18 YEARS
3.1/ 100
METRIC RATING
232nd/ 347
METRIC RANK
6.4%
UNEMPLOYMENT AMONG WOMEN WITH CHILDREN UNDER 18 YEARS
0.0/ 100
METRIC RATING
289th/ 347
METRIC RANK
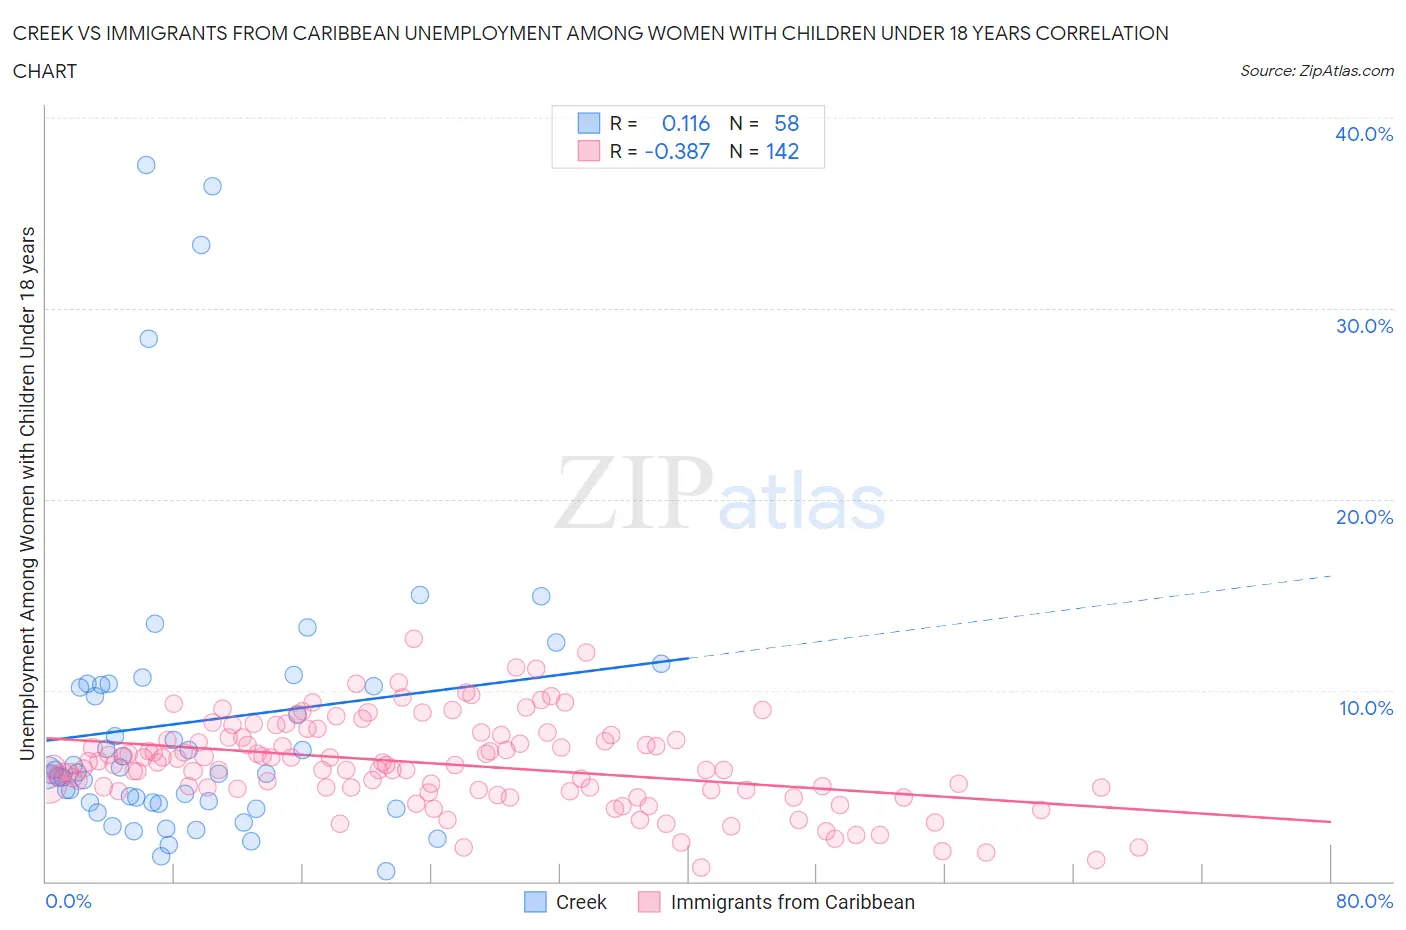
Creek vs Immigrants from Caribbean Unemployment Among Women with Children Under 18 years Correlation Chart
The statistical analysis conducted on geographies consisting of 174,176,310 people shows a poor positive correlation between the proportion of Creek and unemployment rate among women with children under the age of 18 in the United States with a correlation coefficient (R) of 0.116 and weighted average of 5.8%. Similarly, the statistical analysis conducted on geographies consisting of 429,431,421 people shows a mild negative correlation between the proportion of Immigrants from Caribbean and unemployment rate among women with children under the age of 18 in the United States with a correlation coefficient (R) of -0.387 and weighted average of 6.4%, a difference of 10.1%.
Unemployment Among Women with Children Under 18 years Correlation Summary
| Measurement | Creek | Immigrants from Caribbean |
| Minimum | 0.50% | 0.70% |
| Maximum | 37.5% | 12.7% |
| Range | 37.0% | 12.0% |
| Mean | 8.4% | 6.2% |
| Median | 5.7% | 6.1% |
| Interquartile 25% (IQ1) | 4.1% | 4.8% |
| Interquartile 75% (IQ3) | 10.3% | 7.6% |
| Interquartile Range (IQR) | 6.2% | 2.8% |
| Standard Deviation (Sample) | 7.9% | 2.3% |
| Standard Deviation (Population) | 7.8% | 2.3% |
Similar Demographics by Unemployment Among Women with Children Under 18 years
Demographics Similar to Creek by Unemployment Among Women with Children Under 18 years
In terms of unemployment among women with children under 18 years, the demographic groups most similar to Creek are Spanish American (5.8%, a difference of 0.020%), Immigrants from Africa (5.8%, a difference of 0.030%), Immigrants from South America (5.8%, a difference of 0.090%), Guamanian/Chamorro (5.8%, a difference of 0.13%), and Immigrants from Panama (5.8%, a difference of 0.15%).
| Demographics | Rating | Rank | Unemployment Among Women with Children Under 18 years |
| Armenians | 4.5 /100 | #225 | Tragic 5.7% |
| Cherokee | 4.3 /100 | #226 | Tragic 5.7% |
| Sierra Leoneans | 3.8 /100 | #227 | Tragic 5.8% |
| Somalis | 3.5 /100 | #228 | Tragic 5.8% |
| Immigrants | Panama | 3.4 /100 | #229 | Tragic 5.8% |
| Immigrants | South America | 3.2 /100 | #230 | Tragic 5.8% |
| Immigrants | Africa | 3.1 /100 | #231 | Tragic 5.8% |
| Creek | 3.1 /100 | #232 | Tragic 5.8% |
| Spanish Americans | 3.1 /100 | #233 | Tragic 5.8% |
| Guamanians/Chamorros | 2.9 /100 | #234 | Tragic 5.8% |
| Immigrants | Middle Africa | 2.8 /100 | #235 | Tragic 5.8% |
| Alsatians | 2.5 /100 | #236 | Tragic 5.8% |
| Immigrants | Lebanon | 2.4 /100 | #237 | Tragic 5.8% |
| Immigrants | Somalia | 2.2 /100 | #238 | Tragic 5.8% |
| Immigrants | Sierra Leone | 2.0 /100 | #239 | Tragic 5.8% |
Demographics Similar to Immigrants from Caribbean by Unemployment Among Women with Children Under 18 years
In terms of unemployment among women with children under 18 years, the demographic groups most similar to Immigrants from Caribbean are Blackfeet (6.4%, a difference of 0.040%), Immigrants from Guatemala (6.4%, a difference of 0.17%), Mexican (6.4%, a difference of 0.22%), Immigrants from Bangladesh (6.4%, a difference of 0.25%), and Honduran (6.4%, a difference of 0.28%).
| Demographics | Rating | Rank | Unemployment Among Women with Children Under 18 years |
| Immigrants | St. Vincent and the Grenadines | 0.0 /100 | #282 | Tragic 6.3% |
| West Indians | 0.0 /100 | #283 | Tragic 6.3% |
| Immigrants | Grenada | 0.0 /100 | #284 | Tragic 6.3% |
| Bahamians | 0.0 /100 | #285 | Tragic 6.3% |
| Alaskan Athabascans | 0.0 /100 | #286 | Tragic 6.3% |
| Kiowa | 0.0 /100 | #287 | Tragic 6.3% |
| Cree | 0.0 /100 | #288 | Tragic 6.3% |
| Immigrants | Caribbean | 0.0 /100 | #289 | Tragic 6.4% |
| Blackfeet | 0.0 /100 | #290 | Tragic 6.4% |
| Immigrants | Guatemala | 0.0 /100 | #291 | Tragic 6.4% |
| Mexicans | 0.0 /100 | #292 | Tragic 6.4% |
| Immigrants | Bangladesh | 0.0 /100 | #293 | Tragic 6.4% |
| Hondurans | 0.0 /100 | #294 | Tragic 6.4% |
| Barbadians | 0.0 /100 | #295 | Tragic 6.4% |
| Haitians | 0.0 /100 | #296 | Tragic 6.4% |