Immigrants from St. Vincent and the Grenadines vs Pima 8th Grade
COMPARE
Immigrants from St. Vincent and the Grenadines
Pima
8th Grade
8th Grade Comparison
Immigrants from St. Vincent and the Grenadines
Pima
94.6%
8TH GRADE
0.1/ 100
METRIC RATING
283rd/ 347
METRIC RANK
95.6%
8TH GRADE
28.6/ 100
METRIC RATING
192nd/ 347
METRIC RANK
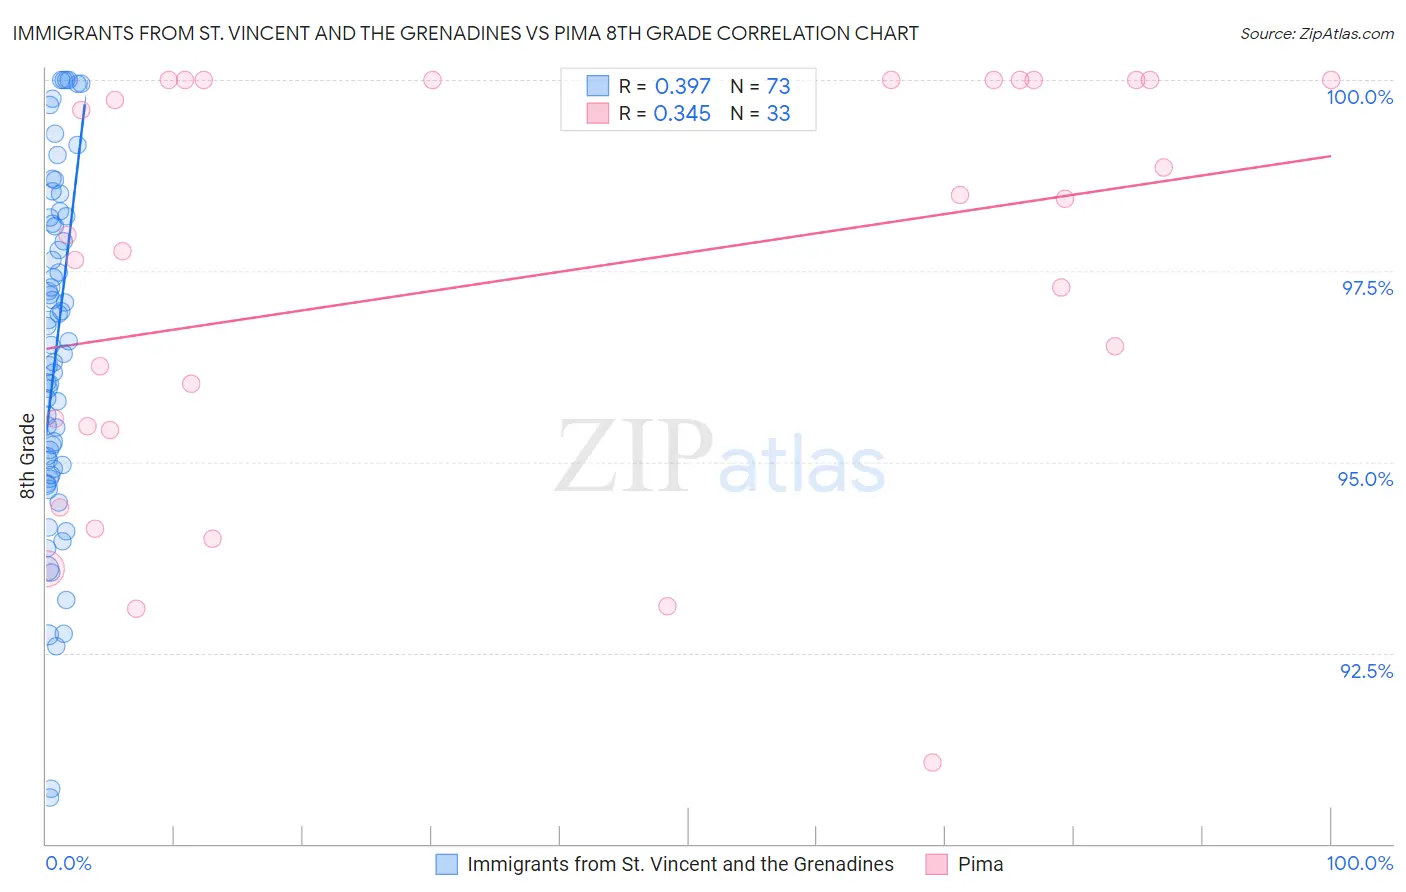
Immigrants from St. Vincent and the Grenadines vs Pima 8th Grade Correlation Chart
The statistical analysis conducted on geographies consisting of 56,191,418 people shows a mild positive correlation between the proportion of Immigrants from St. Vincent and the Grenadines and percentage of population with at least 8th grade education in the United States with a correlation coefficient (R) of 0.397 and weighted average of 94.6%. Similarly, the statistical analysis conducted on geographies consisting of 61,552,136 people shows a mild positive correlation between the proportion of Pima and percentage of population with at least 8th grade education in the United States with a correlation coefficient (R) of 0.345 and weighted average of 95.6%, a difference of 1.1%.
8th Grade Correlation Summary
| Measurement | Immigrants from St. Vincent and the Grenadines | Pima |
| Minimum | 90.6% | 91.1% |
| Maximum | 100.0% | 100.0% |
| Range | 9.4% | 8.9% |
| Mean | 96.4% | 97.4% |
| Median | 96.4% | 98.0% |
| Interquartile 25% (IQ1) | 94.9% | 95.4% |
| Interquartile 75% (IQ3) | 98.2% | 100.0% |
| Interquartile Range (IQR) | 3.3% | 4.6% |
| Standard Deviation (Sample) | 2.2% | 2.7% |
| Standard Deviation (Population) | 2.2% | 2.6% |
Similar Demographics by 8th Grade
Demographics Similar to Immigrants from St. Vincent and the Grenadines by 8th Grade
In terms of 8th grade, the demographic groups most similar to Immigrants from St. Vincent and the Grenadines are Immigrants from Philippines (94.6%, a difference of 0.010%), Immigrants from Eritrea (94.6%, a difference of 0.030%), Immigrants from Barbados (94.5%, a difference of 0.040%), Barbadian (94.6%, a difference of 0.070%), and Immigrants from Bolivia (94.6%, a difference of 0.070%).
| Demographics | Rating | Rank | 8th Grade |
| Peruvians | 0.1 /100 | #276 | Tragic 94.7% |
| Taiwanese | 0.1 /100 | #277 | Tragic 94.7% |
| Armenians | 0.1 /100 | #278 | Tragic 94.7% |
| Immigrants | Trinidad and Tobago | 0.1 /100 | #279 | Tragic 94.6% |
| Barbadians | 0.1 /100 | #280 | Tragic 94.6% |
| Immigrants | Bolivia | 0.1 /100 | #281 | Tragic 94.6% |
| Immigrants | Eritrea | 0.1 /100 | #282 | Tragic 94.6% |
| Immigrants | St. Vincent and the Grenadines | 0.1 /100 | #283 | Tragic 94.6% |
| Immigrants | Philippines | 0.1 /100 | #284 | Tragic 94.6% |
| Immigrants | Barbados | 0.0 /100 | #285 | Tragic 94.5% |
| Immigrants | Peru | 0.0 /100 | #286 | Tragic 94.5% |
| Tohono O'odham | 0.0 /100 | #287 | Tragic 94.5% |
| Malaysians | 0.0 /100 | #288 | Tragic 94.5% |
| British West Indians | 0.0 /100 | #289 | Tragic 94.4% |
| Immigrants | West Indies | 0.0 /100 | #290 | Tragic 94.3% |
Demographics Similar to Pima by 8th Grade
In terms of 8th grade, the demographic groups most similar to Pima are Panamanian (95.6%, a difference of 0.0%), Immigrants from Nepal (95.6%, a difference of 0.010%), Immigrants from Micronesia (95.6%, a difference of 0.020%), Immigrants from Venezuela (95.6%, a difference of 0.020%), and Guamanian/Chamorro (95.6%, a difference of 0.020%).
| Demographics | Rating | Rank | 8th Grade |
| Blacks/African Americans | 34.8 /100 | #185 | Fair 95.6% |
| Brazilians | 34.8 /100 | #186 | Fair 95.6% |
| Sudanese | 33.0 /100 | #187 | Fair 95.6% |
| Liberians | 32.4 /100 | #188 | Fair 95.6% |
| Immigrants | Micronesia | 31.6 /100 | #189 | Fair 95.6% |
| Immigrants | Venezuela | 30.8 /100 | #190 | Fair 95.6% |
| Immigrants | Nepal | 30.2 /100 | #191 | Fair 95.6% |
| Pima | 28.6 /100 | #192 | Fair 95.6% |
| Panamanians | 28.4 /100 | #193 | Fair 95.6% |
| Guamanians/Chamorros | 26.6 /100 | #194 | Fair 95.6% |
| Immigrants | Zaire | 25.2 /100 | #195 | Fair 95.6% |
| Assyrians/Chaldeans/Syriacs | 24.5 /100 | #196 | Fair 95.6% |
| Sierra Leoneans | 24.3 /100 | #197 | Fair 95.6% |
| Paraguayans | 22.6 /100 | #198 | Fair 95.5% |
| Immigrants | Northern Africa | 22.5 /100 | #199 | Fair 95.5% |