Comanche vs Immigrants from Barbados 5th Grade
COMPARE
Comanche
Immigrants from Barbados
5th Grade
5th Grade Comparison
Comanche
Immigrants from Barbados
97.3%
5TH GRADE
42.1/ 100
METRIC RATING
178th/ 347
METRIC RANK
96.6%
5TH GRADE
0.0/ 100
METRIC RATING
288th/ 347
METRIC RANK
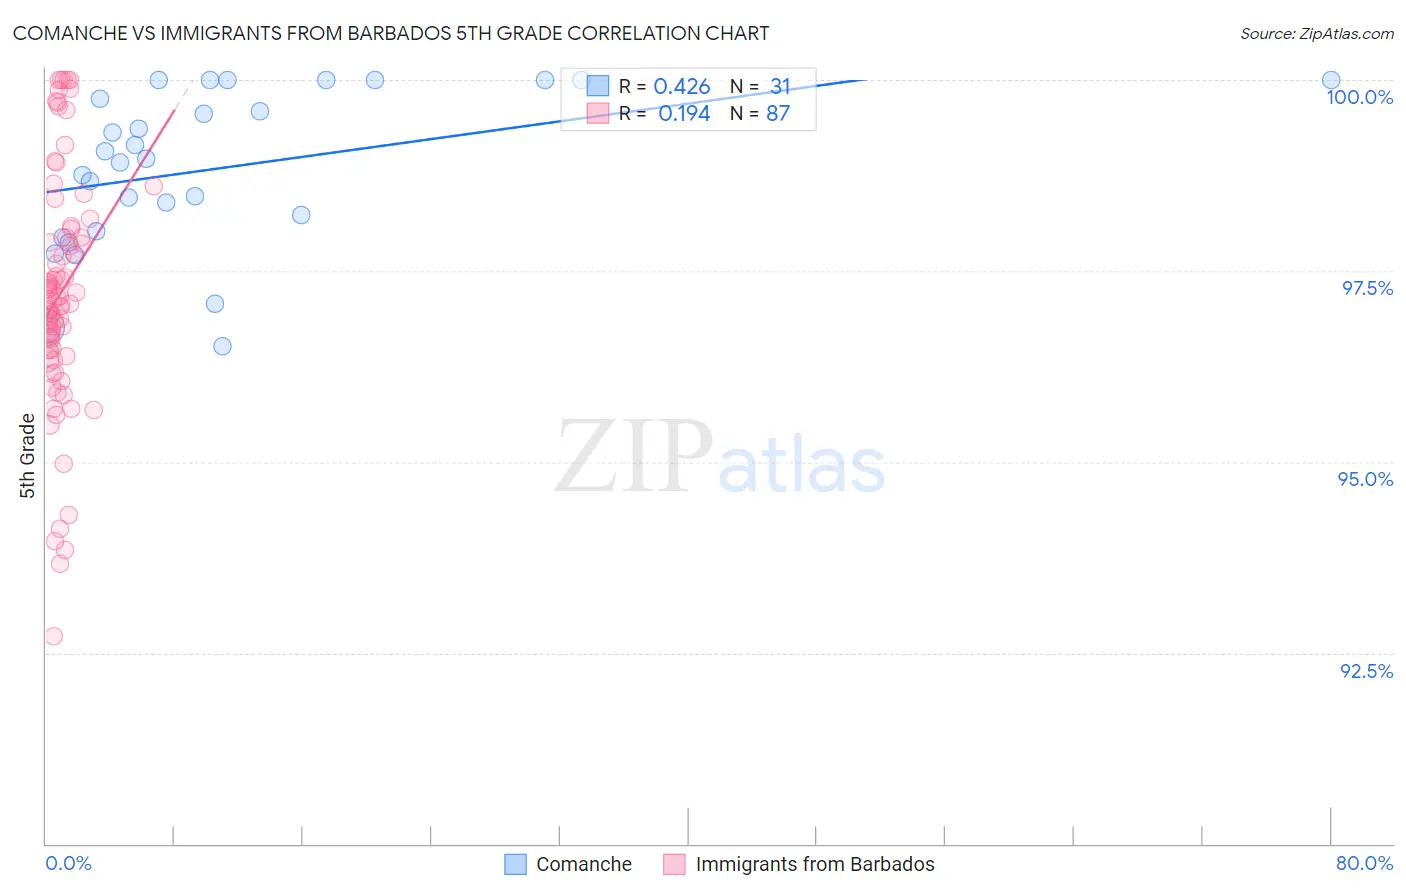
Comanche vs Immigrants from Barbados 5th Grade Correlation Chart
The statistical analysis conducted on geographies consisting of 109,786,530 people shows a moderate positive correlation between the proportion of Comanche and percentage of population with at least 5th grade education in the United States with a correlation coefficient (R) of 0.426 and weighted average of 97.3%. Similarly, the statistical analysis conducted on geographies consisting of 112,788,359 people shows a poor positive correlation between the proportion of Immigrants from Barbados and percentage of population with at least 5th grade education in the United States with a correlation coefficient (R) of 0.194 and weighted average of 96.6%, a difference of 0.77%.
5th Grade Correlation Summary
| Measurement | Comanche | Immigrants from Barbados |
| Minimum | 96.5% | 92.7% |
| Maximum | 100.0% | 100.0% |
| Range | 3.5% | 7.3% |
| Mean | 98.8% | 97.2% |
| Median | 99.0% | 97.1% |
| Interquartile 25% (IQ1) | 98.0% | 96.5% |
| Interquartile 75% (IQ3) | 100.0% | 97.9% |
| Interquartile Range (IQR) | 2.0% | 1.5% |
| Standard Deviation (Sample) | 1.0% | 1.5% |
| Standard Deviation (Population) | 1.0% | 1.5% |
Similar Demographics by 5th Grade
Demographics Similar to Comanche by 5th Grade
In terms of 5th grade, the demographic groups most similar to Comanche are Immigrants from Kenya (97.3%, a difference of 0.010%), Pakistani (97.3%, a difference of 0.010%), Argentinean (97.3%, a difference of 0.010%), Mongolian (97.3%, a difference of 0.010%), and Immigrants from Spain (97.3%, a difference of 0.020%).
| Demographics | Rating | Rank | 5th Grade |
| Immigrants | Sri Lanka | 53.8 /100 | #171 | Average 97.3% |
| Arabs | 53.4 /100 | #172 | Average 97.3% |
| Egyptians | 52.4 /100 | #173 | Average 97.3% |
| Immigrants | Kazakhstan | 50.0 /100 | #174 | Average 97.3% |
| Immigrants | Micronesia | 48.8 /100 | #175 | Average 97.3% |
| Immigrants | Taiwan | 48.4 /100 | #176 | Average 97.3% |
| Immigrants | Spain | 47.0 /100 | #177 | Average 97.3% |
| Comanche | 42.1 /100 | #178 | Average 97.3% |
| Immigrants | Kenya | 40.3 /100 | #179 | Average 97.3% |
| Pakistanis | 40.2 /100 | #180 | Average 97.3% |
| Argentineans | 39.5 /100 | #181 | Fair 97.3% |
| Mongolians | 39.4 /100 | #182 | Fair 97.3% |
| Immigrants | Ukraine | 38.6 /100 | #183 | Fair 97.3% |
| Immigrants | Venezuela | 38.4 /100 | #184 | Fair 97.3% |
| Dutch West Indians | 36.2 /100 | #185 | Fair 97.3% |
Demographics Similar to Immigrants from Barbados by 5th Grade
In terms of 5th grade, the demographic groups most similar to Immigrants from Barbados are Immigrants from Afghanistan (96.6%, a difference of 0.010%), Immigrants from Thailand (96.6%, a difference of 0.030%), Immigrants from St. Vincent and the Grenadines (96.6%, a difference of 0.040%), Immigrants from Trinidad and Tobago (96.6%, a difference of 0.050%), and Houma (96.6%, a difference of 0.060%).
| Demographics | Rating | Rank | 5th Grade |
| Houma | 0.1 /100 | #281 | Tragic 96.6% |
| Barbadians | 0.1 /100 | #282 | Tragic 96.6% |
| Fijians | 0.1 /100 | #283 | Tragic 96.6% |
| Immigrants | Trinidad and Tobago | 0.1 /100 | #284 | Tragic 96.6% |
| Immigrants | St. Vincent and the Grenadines | 0.1 /100 | #285 | Tragic 96.6% |
| Immigrants | Thailand | 0.1 /100 | #286 | Tragic 96.6% |
| Immigrants | Afghanistan | 0.1 /100 | #287 | Tragic 96.6% |
| Immigrants | Barbados | 0.0 /100 | #288 | Tragic 96.6% |
| Immigrants | West Indies | 0.0 /100 | #289 | Tragic 96.5% |
| British West Indians | 0.0 /100 | #290 | Tragic 96.5% |
| Malaysians | 0.0 /100 | #291 | Tragic 96.5% |
| Somalis | 0.0 /100 | #292 | Tragic 96.5% |
| Immigrants | Grenada | 0.0 /100 | #293 | Tragic 96.5% |
| Immigrants | Eritrea | 0.0 /100 | #294 | Tragic 96.4% |
| Immigrants | Somalia | 0.0 /100 | #295 | Tragic 96.4% |