Comanche vs Guyanese 2nd Grade
COMPARE
Comanche
Guyanese
2nd Grade
2nd Grade Comparison
Comanche
Guyanese
97.9%
2ND GRADE
62.8/ 100
METRIC RATING
159th/ 347
METRIC RANK
96.8%
2ND GRADE
0.0/ 100
METRIC RATING
311th/ 347
METRIC RANK
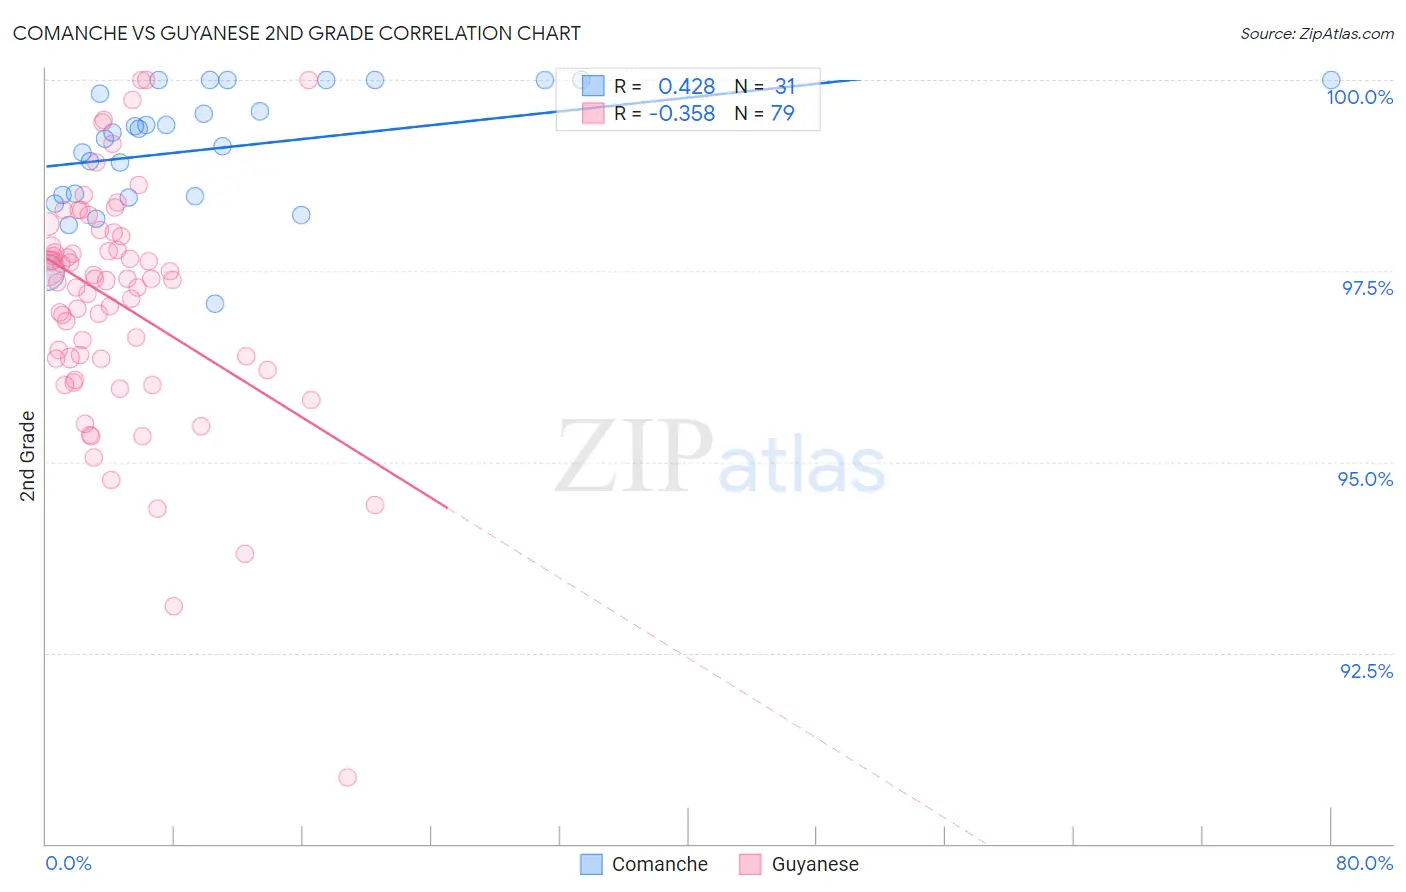
Comanche vs Guyanese 2nd Grade Correlation Chart
The statistical analysis conducted on geographies consisting of 109,786,530 people shows a moderate positive correlation between the proportion of Comanche and percentage of population with at least 2nd grade education in the United States with a correlation coefficient (R) of 0.428 and weighted average of 97.9%. Similarly, the statistical analysis conducted on geographies consisting of 176,921,765 people shows a mild negative correlation between the proportion of Guyanese and percentage of population with at least 2nd grade education in the United States with a correlation coefficient (R) of -0.358 and weighted average of 96.8%, a difference of 1.1%.
2nd Grade Correlation Summary
| Measurement | Comanche | Guyanese |
| Minimum | 97.1% | 90.9% |
| Maximum | 100.0% | 100.0% |
| Range | 2.9% | 9.1% |
| Mean | 99.1% | 97.1% |
| Median | 99.3% | 97.4% |
| Interquartile 25% (IQ1) | 98.5% | 96.4% |
| Interquartile 75% (IQ3) | 100.0% | 98.0% |
| Interquartile Range (IQR) | 1.5% | 1.6% |
| Standard Deviation (Sample) | 0.80% | 1.6% |
| Standard Deviation (Population) | 0.79% | 1.5% |
Similar Demographics by 2nd Grade
Demographics Similar to Comanche by 2nd Grade
In terms of 2nd grade, the demographic groups most similar to Comanche are Dutch West Indian (97.9%, a difference of 0.0%), Venezuelan (97.9%, a difference of 0.0%), Immigrants from Iran (97.9%, a difference of 0.0%), French American Indian (97.9%, a difference of 0.010%), and Immigrants from Eastern Europe (97.9%, a difference of 0.010%).
| Demographics | Rating | Rank | 2nd Grade |
| Immigrants | North Macedonia | 68.5 /100 | #152 | Good 97.9% |
| Immigrants | South Central Asia | 68.3 /100 | #153 | Good 97.9% |
| Marshallese | 67.7 /100 | #154 | Good 97.9% |
| French American Indians | 64.3 /100 | #155 | Good 97.9% |
| Dutch West Indians | 63.8 /100 | #156 | Good 97.9% |
| Venezuelans | 63.3 /100 | #157 | Good 97.9% |
| Immigrants | Iran | 62.8 /100 | #158 | Good 97.9% |
| Comanche | 62.8 /100 | #159 | Good 97.9% |
| Immigrants | Eastern Europe | 61.1 /100 | #160 | Good 97.9% |
| Immigrants | Russia | 60.3 /100 | #161 | Good 97.9% |
| Immigrants | Italy | 60.2 /100 | #162 | Good 97.9% |
| Bermudans | 59.4 /100 | #163 | Average 97.9% |
| Ugandans | 56.6 /100 | #164 | Average 97.9% |
| Spanish Americans | 56.4 /100 | #165 | Average 97.9% |
| Immigrants | Jordan | 56.3 /100 | #166 | Average 97.9% |
Demographics Similar to Guyanese by 2nd Grade
In terms of 2nd grade, the demographic groups most similar to Guyanese are Belizean (96.8%, a difference of 0.010%), Sri Lankan (96.8%, a difference of 0.010%), Cape Verdean (96.8%, a difference of 0.010%), Immigrants from the Azores (96.8%, a difference of 0.020%), and Immigrants from Haiti (96.8%, a difference of 0.020%).
| Demographics | Rating | Rank | 2nd Grade |
| Immigrants | Caribbean | 0.0 /100 | #304 | Tragic 96.9% |
| Nicaraguans | 0.0 /100 | #305 | Tragic 96.9% |
| Immigrants | Somalia | 0.0 /100 | #306 | Tragic 96.9% |
| Immigrants | Azores | 0.0 /100 | #307 | Tragic 96.8% |
| Immigrants | Haiti | 0.0 /100 | #308 | Tragic 96.8% |
| Belizeans | 0.0 /100 | #309 | Tragic 96.8% |
| Sri Lankans | 0.0 /100 | #310 | Tragic 96.8% |
| Guyanese | 0.0 /100 | #311 | Tragic 96.8% |
| Cape Verdeans | 0.0 /100 | #312 | Tragic 96.8% |
| Hispanics or Latinos | 0.0 /100 | #313 | Tragic 96.8% |
| Immigrants | Ecuador | 0.0 /100 | #314 | Tragic 96.8% |
| Immigrants | Belize | 0.0 /100 | #315 | Tragic 96.8% |
| Hondurans | 0.0 /100 | #316 | Tragic 96.7% |
| Immigrants | Laos | 0.0 /100 | #317 | Tragic 96.7% |
| Indonesians | 0.0 /100 | #318 | Tragic 96.7% |