Colville vs Macedonian No Schooling Completed
COMPARE
Colville
Macedonian
No Schooling Completed
No Schooling Completed Comparison
Colville
Macedonians
1.9%
NO SCHOOLING COMPLETED
90.4/ 100
METRIC RATING
132nd/ 347
METRIC RANK
1.7%
NO SCHOOLING COMPLETED
99.3/ 100
METRIC RATING
79th/ 347
METRIC RANK
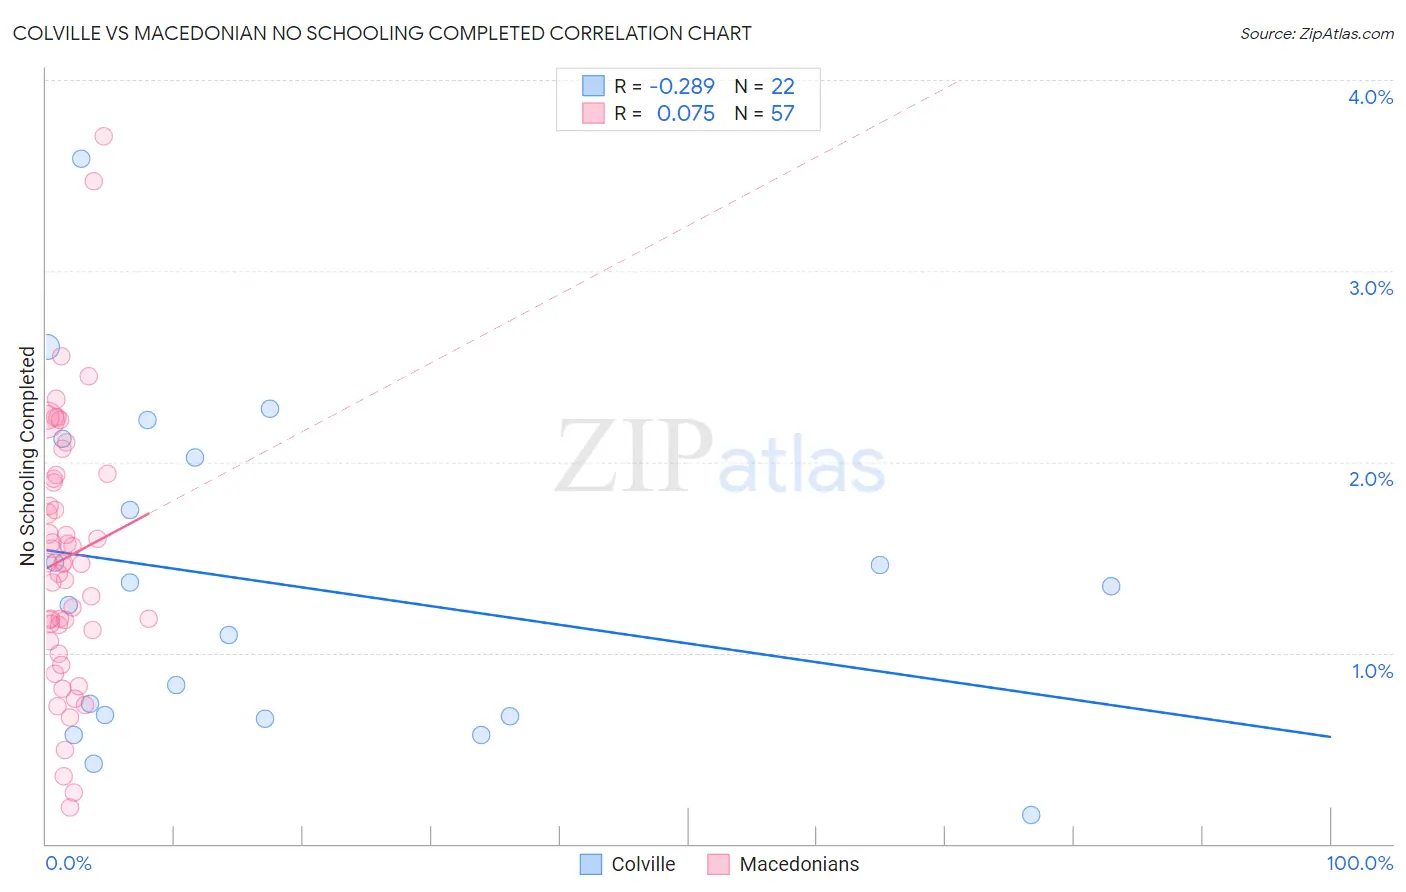
Colville vs Macedonian No Schooling Completed Correlation Chart
The statistical analysis conducted on geographies consisting of 34,498,790 people shows a weak negative correlation between the proportion of Colville and percentage of population with no schooling in the United States with a correlation coefficient (R) of -0.289 and weighted average of 1.9%. Similarly, the statistical analysis conducted on geographies consisting of 131,792,248 people shows a slight positive correlation between the proportion of Macedonians and percentage of population with no schooling in the United States with a correlation coefficient (R) of 0.075 and weighted average of 1.7%, a difference of 10.9%.
No Schooling Completed Correlation Summary
| Measurement | Colville | Macedonian |
| Minimum | 0.15% | 0.19% |
| Maximum | 3.6% | 3.7% |
| Range | 3.4% | 3.5% |
| Mean | 1.4% | 1.5% |
| Median | 1.3% | 1.5% |
| Interquartile 25% (IQ1) | 0.67% | 1.1% |
| Interquartile 75% (IQ3) | 2.0% | 1.9% |
| Interquartile Range (IQR) | 1.4% | 0.83% |
| Standard Deviation (Sample) | 0.85% | 0.69% |
| Standard Deviation (Population) | 0.83% | 0.69% |
Similar Demographics by No Schooling Completed
Demographics Similar to Colville by No Schooling Completed
In terms of no schooling completed, the demographic groups most similar to Colville are Immigrants from Turkey (1.9%, a difference of 0.10%), Menominee (1.9%, a difference of 0.35%), Immigrants from Hungary (1.9%, a difference of 0.50%), Palestinian (1.9%, a difference of 0.61%), and Seminole (1.9%, a difference of 0.72%).
| Demographics | Rating | Rank | No Schooling Completed |
| Immigrants | Europe | 93.7 /100 | #125 | Exceptional 1.9% |
| Immigrants | Romania | 92.6 /100 | #126 | Exceptional 1.9% |
| Israelis | 92.4 /100 | #127 | Exceptional 1.9% |
| Spaniards | 92.3 /100 | #128 | Exceptional 1.9% |
| Seminole | 92.0 /100 | #129 | Exceptional 1.9% |
| Palestinians | 91.8 /100 | #130 | Exceptional 1.9% |
| Immigrants | Hungary | 91.6 /100 | #131 | Exceptional 1.9% |
| Colville | 90.4 /100 | #132 | Exceptional 1.9% |
| Immigrants | Turkey | 90.2 /100 | #133 | Exceptional 1.9% |
| Menominee | 89.6 /100 | #134 | Excellent 1.9% |
| Hmong | 88.5 /100 | #135 | Excellent 1.9% |
| Burmese | 88.2 /100 | #136 | Excellent 1.9% |
| Filipinos | 85.5 /100 | #137 | Excellent 2.0% |
| Immigrants | Israel | 85.4 /100 | #138 | Excellent 2.0% |
| Jordanians | 84.5 /100 | #139 | Excellent 2.0% |
Demographics Similar to Macedonians by No Schooling Completed
In terms of no schooling completed, the demographic groups most similar to Macedonians are Cypriot (1.7%, a difference of 0.010%), Icelander (1.7%, a difference of 0.050%), Delaware (1.7%, a difference of 0.080%), Immigrants from Sweden (1.7%, a difference of 0.12%), and Immigrants from South Africa (1.7%, a difference of 0.14%).
| Demographics | Rating | Rank | No Schooling Completed |
| Cajuns | 99.5 /100 | #72 | Exceptional 1.7% |
| Immigrants | India | 99.4 /100 | #73 | Exceptional 1.7% |
| Zimbabweans | 99.4 /100 | #74 | Exceptional 1.7% |
| Immigrants | Belgium | 99.3 /100 | #75 | Exceptional 1.7% |
| Cherokee | 99.3 /100 | #76 | Exceptional 1.7% |
| Immigrants | Sweden | 99.3 /100 | #77 | Exceptional 1.7% |
| Delaware | 99.3 /100 | #78 | Exceptional 1.7% |
| Macedonians | 99.3 /100 | #79 | Exceptional 1.7% |
| Cypriots | 99.3 /100 | #80 | Exceptional 1.7% |
| Icelanders | 99.3 /100 | #81 | Exceptional 1.7% |
| Immigrants | South Africa | 99.3 /100 | #82 | Exceptional 1.7% |
| Potawatomi | 99.3 /100 | #83 | Exceptional 1.7% |
| Immigrants | Denmark | 99.2 /100 | #84 | Exceptional 1.7% |
| Immigrants | Australia | 99.2 /100 | #85 | Exceptional 1.7% |
| Ukrainians | 99.2 /100 | #86 | Exceptional 1.8% |