Immigrants from Haiti vs Macedonian No Schooling Completed
COMPARE
Immigrants from Haiti
Macedonian
No Schooling Completed
No Schooling Completed Comparison
Immigrants from Haiti
Macedonians
3.0%
NO SCHOOLING COMPLETED
0.0/ 100
METRIC RATING
307th/ 347
METRIC RANK
1.7%
NO SCHOOLING COMPLETED
99.3/ 100
METRIC RATING
79th/ 347
METRIC RANK
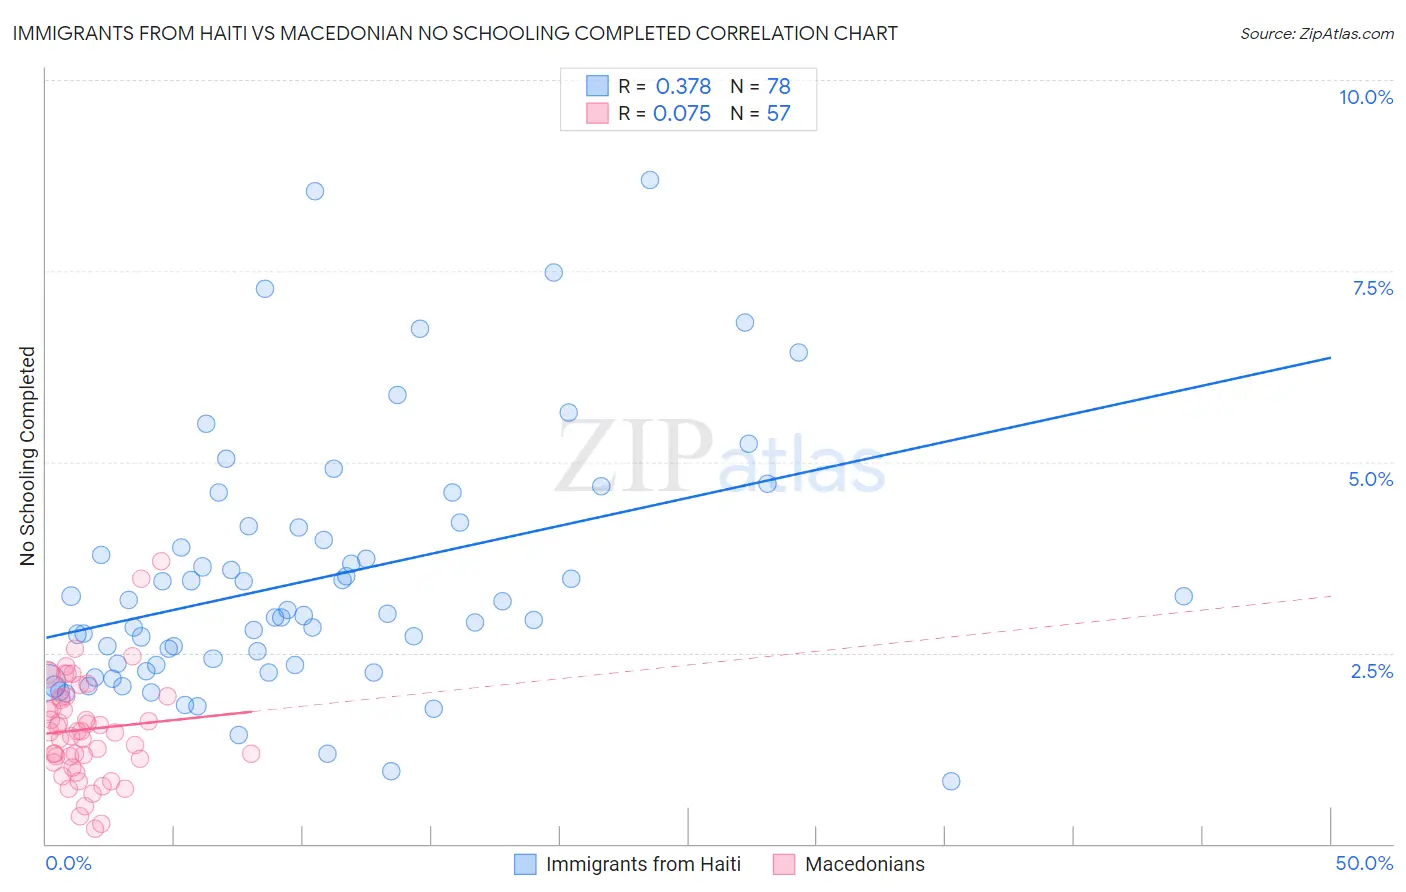
Immigrants from Haiti vs Macedonian No Schooling Completed Correlation Chart
The statistical analysis conducted on geographies consisting of 224,149,714 people shows a mild positive correlation between the proportion of Immigrants from Haiti and percentage of population with no schooling in the United States with a correlation coefficient (R) of 0.378 and weighted average of 3.0%. Similarly, the statistical analysis conducted on geographies consisting of 131,792,248 people shows a slight positive correlation between the proportion of Macedonians and percentage of population with no schooling in the United States with a correlation coefficient (R) of 0.075 and weighted average of 1.7%, a difference of 72.4%.
No Schooling Completed Correlation Summary
| Measurement | Immigrants from Haiti | Macedonian |
| Minimum | 0.82% | 0.19% |
| Maximum | 8.7% | 3.7% |
| Range | 7.9% | 3.5% |
| Mean | 3.5% | 1.5% |
| Median | 3.0% | 1.5% |
| Interquartile 25% (IQ1) | 2.3% | 1.1% |
| Interquartile 75% (IQ3) | 4.1% | 1.9% |
| Interquartile Range (IQR) | 1.8% | 0.83% |
| Standard Deviation (Sample) | 1.7% | 0.69% |
| Standard Deviation (Population) | 1.6% | 0.69% |
Similar Demographics by No Schooling Completed
Demographics Similar to Immigrants from Haiti by No Schooling Completed
In terms of no schooling completed, the demographic groups most similar to Immigrants from Haiti are Belizean (3.0%, a difference of 0.080%), Immigrants from Somalia (3.0%, a difference of 0.16%), Hispanic or Latino (3.0%, a difference of 0.97%), Guyanese (3.0%, a difference of 1.0%), and Immigrants from the Azores (3.0%, a difference of 1.1%).
| Demographics | Rating | Rank | No Schooling Completed |
| Haitians | 0.0 /100 | #300 | Tragic 2.9% |
| Immigrants | South Eastern Asia | 0.0 /100 | #301 | Tragic 2.9% |
| Immigrants | Caribbean | 0.0 /100 | #302 | Tragic 2.9% |
| Somalis | 0.0 /100 | #303 | Tragic 2.9% |
| Nicaraguans | 0.0 /100 | #304 | Tragic 2.9% |
| Ecuadorians | 0.0 /100 | #305 | Tragic 3.0% |
| Belizeans | 0.0 /100 | #306 | Tragic 3.0% |
| Immigrants | Haiti | 0.0 /100 | #307 | Tragic 3.0% |
| Immigrants | Somalia | 0.0 /100 | #308 | Tragic 3.0% |
| Hispanics or Latinos | 0.0 /100 | #309 | Tragic 3.0% |
| Guyanese | 0.0 /100 | #310 | Tragic 3.0% |
| Immigrants | Azores | 0.0 /100 | #311 | Tragic 3.0% |
| Sri Lankans | 0.0 /100 | #312 | Tragic 3.0% |
| Hondurans | 0.0 /100 | #313 | Tragic 3.1% |
| Immigrants | Belize | 0.0 /100 | #314 | Tragic 3.1% |
Demographics Similar to Macedonians by No Schooling Completed
In terms of no schooling completed, the demographic groups most similar to Macedonians are Cypriot (1.7%, a difference of 0.010%), Icelander (1.7%, a difference of 0.050%), Delaware (1.7%, a difference of 0.080%), Immigrants from Sweden (1.7%, a difference of 0.12%), and Immigrants from South Africa (1.7%, a difference of 0.14%).
| Demographics | Rating | Rank | No Schooling Completed |
| Cajuns | 99.5 /100 | #72 | Exceptional 1.7% |
| Immigrants | India | 99.4 /100 | #73 | Exceptional 1.7% |
| Zimbabweans | 99.4 /100 | #74 | Exceptional 1.7% |
| Immigrants | Belgium | 99.3 /100 | #75 | Exceptional 1.7% |
| Cherokee | 99.3 /100 | #76 | Exceptional 1.7% |
| Immigrants | Sweden | 99.3 /100 | #77 | Exceptional 1.7% |
| Delaware | 99.3 /100 | #78 | Exceptional 1.7% |
| Macedonians | 99.3 /100 | #79 | Exceptional 1.7% |
| Cypriots | 99.3 /100 | #80 | Exceptional 1.7% |
| Icelanders | 99.3 /100 | #81 | Exceptional 1.7% |
| Immigrants | South Africa | 99.3 /100 | #82 | Exceptional 1.7% |
| Potawatomi | 99.3 /100 | #83 | Exceptional 1.7% |
| Immigrants | Denmark | 99.2 /100 | #84 | Exceptional 1.7% |
| Immigrants | Australia | 99.2 /100 | #85 | Exceptional 1.7% |
| Ukrainians | 99.2 /100 | #86 | Exceptional 1.8% |