Potawatomi vs Macedonian No Schooling Completed
COMPARE
Potawatomi
Macedonian
No Schooling Completed
No Schooling Completed Comparison
Potawatomi
Macedonians
1.7%
NO SCHOOLING COMPLETED
99.3/ 100
METRIC RATING
83rd/ 347
METRIC RANK
1.7%
NO SCHOOLING COMPLETED
99.3/ 100
METRIC RATING
79th/ 347
METRIC RANK
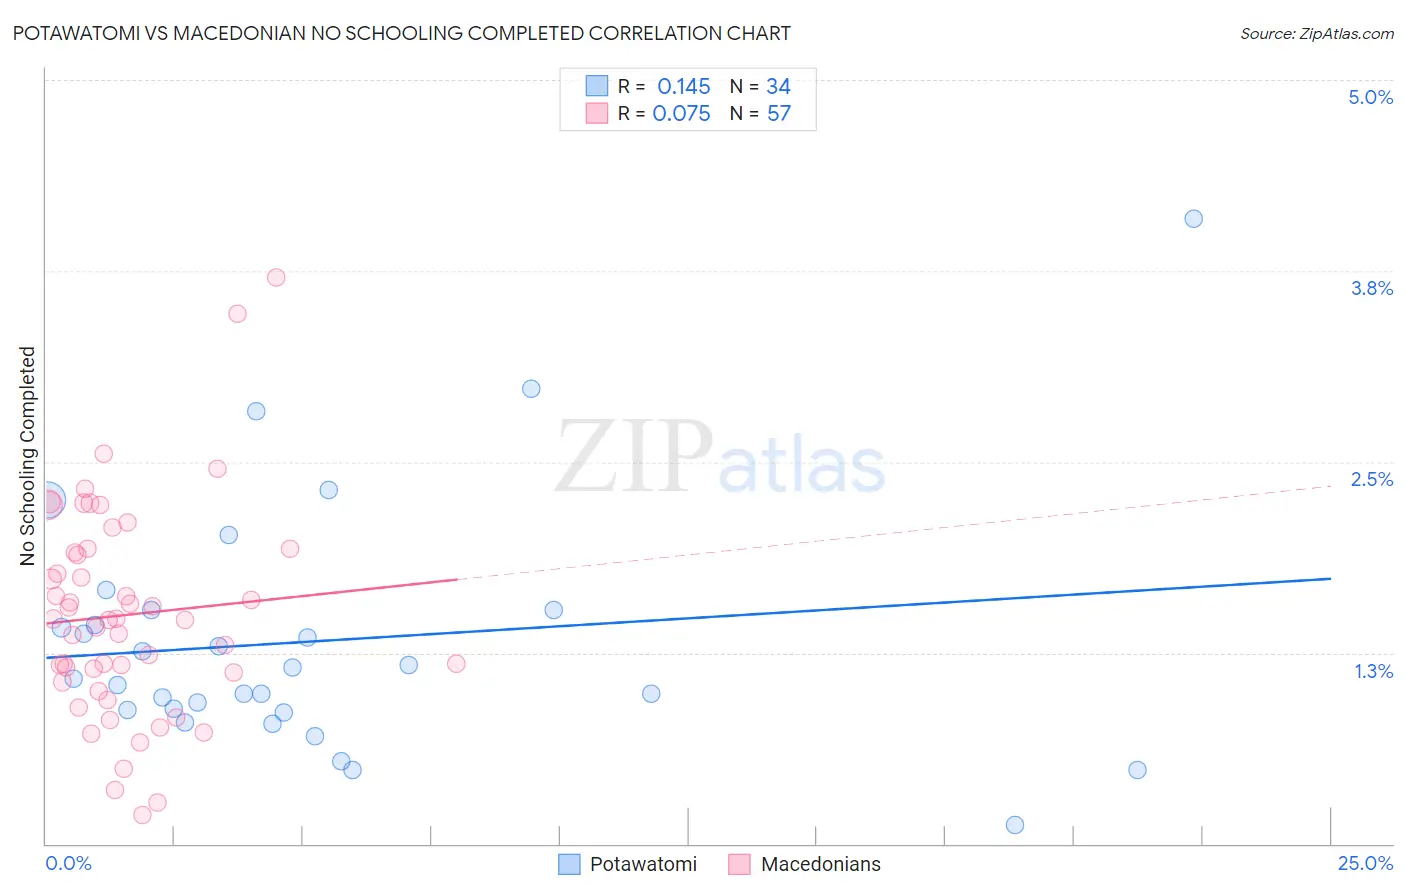
Potawatomi vs Macedonian No Schooling Completed Correlation Chart
The statistical analysis conducted on geographies consisting of 117,110,177 people shows a poor positive correlation between the proportion of Potawatomi and percentage of population with no schooling in the United States with a correlation coefficient (R) of 0.145 and weighted average of 1.7%. Similarly, the statistical analysis conducted on geographies consisting of 131,792,248 people shows a slight positive correlation between the proportion of Macedonians and percentage of population with no schooling in the United States with a correlation coefficient (R) of 0.075 and weighted average of 1.7%, a difference of 0.25%.
No Schooling Completed Correlation Summary
| Measurement | Potawatomi | Macedonian |
| Minimum | 0.12% | 0.19% |
| Maximum | 4.1% | 3.7% |
| Range | 4.0% | 3.5% |
| Mean | 1.3% | 1.5% |
| Median | 1.1% | 1.5% |
| Interquartile 25% (IQ1) | 0.88% | 1.1% |
| Interquartile 75% (IQ3) | 1.5% | 1.9% |
| Interquartile Range (IQR) | 0.65% | 0.83% |
| Standard Deviation (Sample) | 0.80% | 0.69% |
| Standard Deviation (Population) | 0.79% | 0.69% |
Demographics Similar to Potawatomi and Macedonians by No Schooling Completed
In terms of no schooling completed, the demographic groups most similar to Potawatomi are Immigrants from Denmark (1.7%, a difference of 0.050%), Immigrants from Australia (1.7%, a difference of 0.090%), Immigrants from South Africa (1.7%, a difference of 0.11%), Ukrainian (1.8%, a difference of 0.14%), and Icelander (1.7%, a difference of 0.20%). Similarly, the demographic groups most similar to Macedonians are Cypriot (1.7%, a difference of 0.010%), Icelander (1.7%, a difference of 0.050%), Delaware (1.7%, a difference of 0.080%), Immigrants from Sweden (1.7%, a difference of 0.12%), and Immigrants from South Africa (1.7%, a difference of 0.14%).
| Demographics | Rating | Rank | No Schooling Completed |
| Immigrants | England | 99.5 /100 | #71 | Exceptional 1.7% |
| Cajuns | 99.5 /100 | #72 | Exceptional 1.7% |
| Immigrants | India | 99.4 /100 | #73 | Exceptional 1.7% |
| Zimbabweans | 99.4 /100 | #74 | Exceptional 1.7% |
| Immigrants | Belgium | 99.3 /100 | #75 | Exceptional 1.7% |
| Cherokee | 99.3 /100 | #76 | Exceptional 1.7% |
| Immigrants | Sweden | 99.3 /100 | #77 | Exceptional 1.7% |
| Delaware | 99.3 /100 | #78 | Exceptional 1.7% |
| Macedonians | 99.3 /100 | #79 | Exceptional 1.7% |
| Cypriots | 99.3 /100 | #80 | Exceptional 1.7% |
| Icelanders | 99.3 /100 | #81 | Exceptional 1.7% |
| Immigrants | South Africa | 99.3 /100 | #82 | Exceptional 1.7% |
| Potawatomi | 99.3 /100 | #83 | Exceptional 1.7% |
| Immigrants | Denmark | 99.2 /100 | #84 | Exceptional 1.7% |
| Immigrants | Australia | 99.2 /100 | #85 | Exceptional 1.7% |
| Ukrainians | 99.2 /100 | #86 | Exceptional 1.8% |
| Osage | 99.2 /100 | #87 | Exceptional 1.8% |
| Immigrants | Western Europe | 99.2 /100 | #88 | Exceptional 1.8% |
| South Africans | 99.1 /100 | #89 | Exceptional 1.8% |
| Sioux | 99.0 /100 | #90 | Exceptional 1.8% |
| Immigrants | Germany | 99.0 /100 | #91 | Exceptional 1.8% |