Colombian vs Immigrants from Eastern Asia 11th Grade
COMPARE
Colombian
Immigrants from Eastern Asia
11th Grade
11th Grade Comparison
Colombians
Immigrants from Eastern Asia
91.7%
11TH GRADE
2.8/ 100
METRIC RATING
236th/ 347
METRIC RANK
92.7%
11TH GRADE
72.6/ 100
METRIC RATING
157th/ 347
METRIC RANK
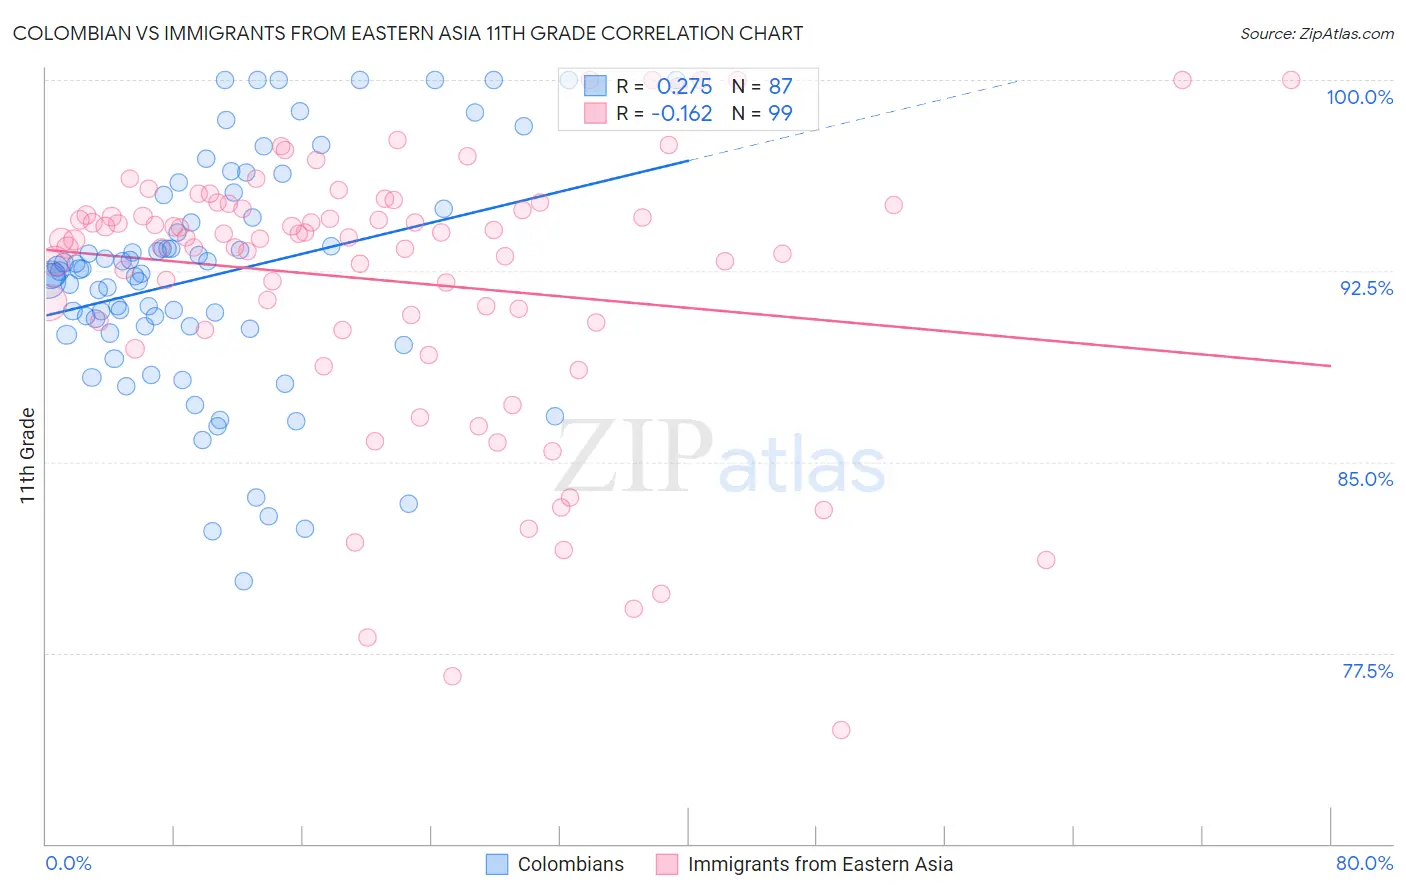
Colombian vs Immigrants from Eastern Asia 11th Grade Correlation Chart
The statistical analysis conducted on geographies consisting of 419,682,710 people shows a weak positive correlation between the proportion of Colombians and percentage of population with at least 11th grade education in the United States with a correlation coefficient (R) of 0.275 and weighted average of 91.7%. Similarly, the statistical analysis conducted on geographies consisting of 499,846,352 people shows a poor negative correlation between the proportion of Immigrants from Eastern Asia and percentage of population with at least 11th grade education in the United States with a correlation coefficient (R) of -0.162 and weighted average of 92.7%, a difference of 1.1%.
11th Grade Correlation Summary
| Measurement | Colombian | Immigrants from Eastern Asia |
| Minimum | 80.3% | 74.5% |
| Maximum | 100.0% | 100.0% |
| Range | 19.7% | 25.5% |
| Mean | 92.3% | 92.1% |
| Median | 92.5% | 93.8% |
| Interquartile 25% (IQ1) | 90.3% | 90.5% |
| Interquartile 75% (IQ3) | 94.9% | 95.1% |
| Interquartile Range (IQR) | 4.7% | 4.6% |
| Standard Deviation (Sample) | 4.5% | 5.4% |
| Standard Deviation (Population) | 4.5% | 5.4% |
Similar Demographics by 11th Grade
Demographics Similar to Colombians by 11th Grade
In terms of 11th grade, the demographic groups most similar to Colombians are Subsaharan African (91.7%, a difference of 0.0%), Immigrants from Bolivia (91.7%, a difference of 0.0%), Armenian (91.7%, a difference of 0.010%), Comanche (91.7%, a difference of 0.020%), and Hopi (91.7%, a difference of 0.030%).
| Demographics | Rating | Rank | 11th Grade |
| Nigerians | 4.3 /100 | #229 | Tragic 91.8% |
| Immigrants | Afghanistan | 3.9 /100 | #230 | Tragic 91.8% |
| Choctaw | 3.7 /100 | #231 | Tragic 91.8% |
| Uruguayans | 3.5 /100 | #232 | Tragic 91.8% |
| Cheyenne | 3.3 /100 | #233 | Tragic 91.8% |
| Armenians | 2.9 /100 | #234 | Tragic 91.7% |
| Sub-Saharan Africans | 2.9 /100 | #235 | Tragic 91.7% |
| Colombians | 2.8 /100 | #236 | Tragic 91.7% |
| Immigrants | Bolivia | 2.8 /100 | #237 | Tragic 91.7% |
| Comanche | 2.6 /100 | #238 | Tragic 91.7% |
| Hopi | 2.5 /100 | #239 | Tragic 91.7% |
| South Americans | 2.0 /100 | #240 | Tragic 91.6% |
| Bahamians | 1.8 /100 | #241 | Tragic 91.6% |
| Immigrants | Middle Africa | 1.6 /100 | #242 | Tragic 91.6% |
| Immigrants | Thailand | 1.4 /100 | #243 | Tragic 91.6% |
Demographics Similar to Immigrants from Eastern Asia by 11th Grade
In terms of 11th grade, the demographic groups most similar to Immigrants from Eastern Asia are Immigrants from Spain (92.7%, a difference of 0.0%), Osage (92.7%, a difference of 0.010%), Argentinean (92.7%, a difference of 0.010%), Immigrants from Venezuela (92.7%, a difference of 0.010%), and American (92.7%, a difference of 0.010%).
| Demographics | Rating | Rank | 11th Grade |
| Immigrants | Egypt | 77.5 /100 | #150 | Good 92.8% |
| Potawatomi | 74.3 /100 | #151 | Good 92.8% |
| Iraqis | 74.2 /100 | #152 | Good 92.8% |
| Brazilians | 73.9 /100 | #153 | Good 92.8% |
| Osage | 73.4 /100 | #154 | Good 92.7% |
| Argentineans | 73.4 /100 | #155 | Good 92.7% |
| Immigrants | Spain | 73.0 /100 | #156 | Good 92.7% |
| Immigrants | Eastern Asia | 72.6 /100 | #157 | Good 92.7% |
| Immigrants | Venezuela | 72.0 /100 | #158 | Good 92.7% |
| Americans | 71.7 /100 | #159 | Good 92.7% |
| Immigrants | Lebanon | 70.7 /100 | #160 | Good 92.7% |
| Immigrants | Argentina | 69.8 /100 | #161 | Good 92.7% |
| Paraguayans | 68.7 /100 | #162 | Good 92.7% |
| Immigrants | Nonimmigrants | 66.6 /100 | #163 | Good 92.7% |
| Spanish | 66.2 /100 | #164 | Good 92.7% |