Colombian vs Immigrants from Eastern Asia No Vehicles in Household
COMPARE
Colombian
Immigrants from Eastern Asia
No Vehicles in Household
No Vehicles in Household Comparison
Colombians
Immigrants from Eastern Asia
10.0%
NO VEHICLES IN HOUSEHOLD
73.9/ 100
METRIC RATING
150th/ 347
METRIC RANK
13.5%
NO VEHICLES IN HOUSEHOLD
0.0/ 100
METRIC RATING
282nd/ 347
METRIC RANK
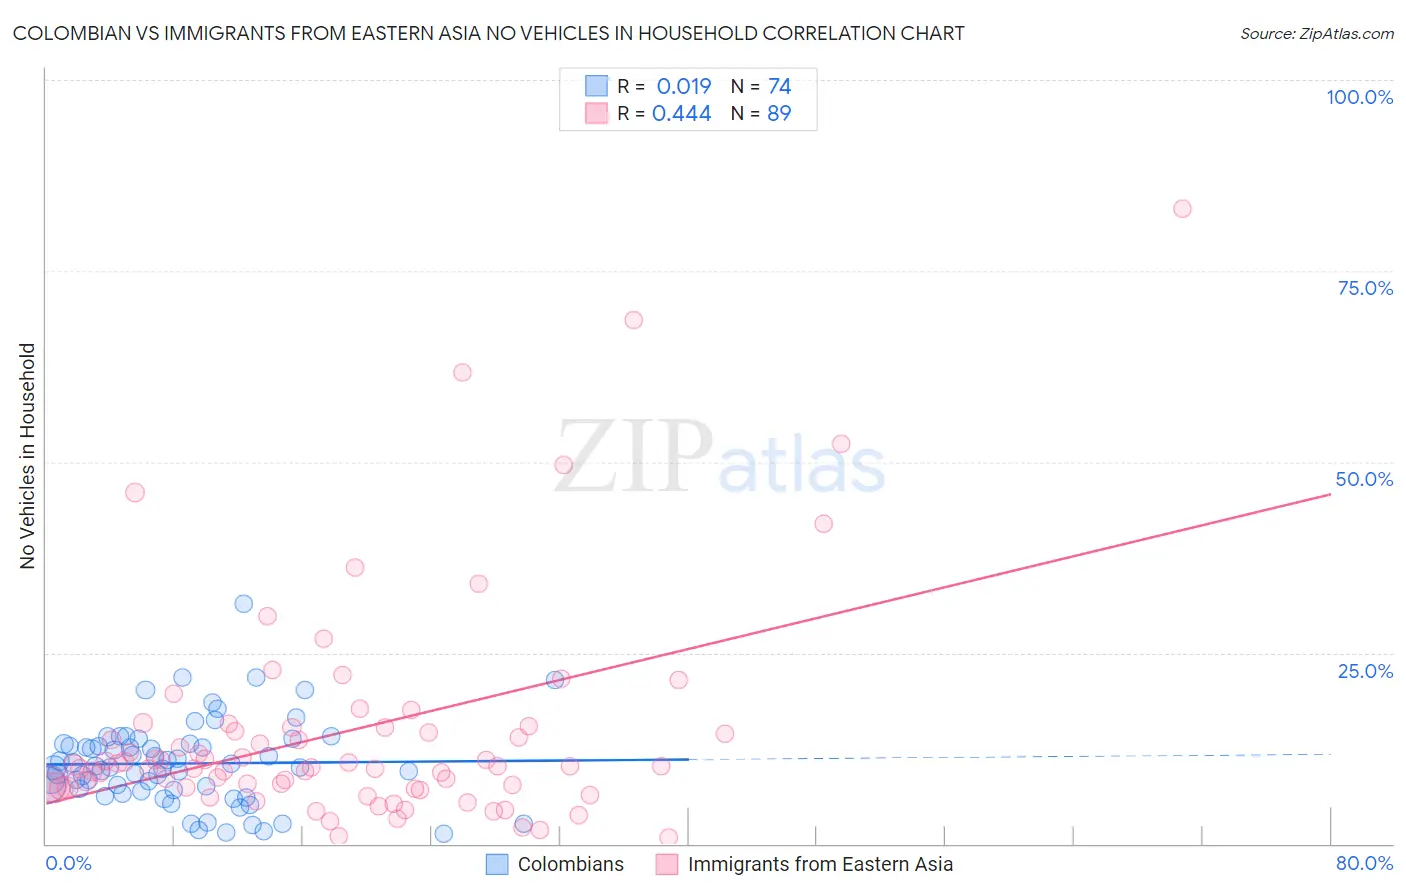
Colombian vs Immigrants from Eastern Asia No Vehicles in Household Correlation Chart
The statistical analysis conducted on geographies consisting of 403,339,443 people shows no correlation between the proportion of Colombians and percentage of households with no vehicle available in the United States with a correlation coefficient (R) of 0.019 and weighted average of 10.0%. Similarly, the statistical analysis conducted on geographies consisting of 497,372,684 people shows a moderate positive correlation between the proportion of Immigrants from Eastern Asia and percentage of households with no vehicle available in the United States with a correlation coefficient (R) of 0.444 and weighted average of 13.5%, a difference of 35.0%.
No Vehicles in Household Correlation Summary
| Measurement | Colombian | Immigrants from Eastern Asia |
| Minimum | 1.4% | 0.81% |
| Maximum | 31.4% | 83.2% |
| Range | 30.0% | 82.4% |
| Mean | 10.5% | 14.7% |
| Median | 10.0% | 10.1% |
| Interquartile 25% (IQ1) | 7.0% | 7.4% |
| Interquartile 75% (IQ3) | 13.0% | 15.2% |
| Interquartile Range (IQR) | 6.0% | 7.9% |
| Standard Deviation (Sample) | 5.5% | 14.7% |
| Standard Deviation (Population) | 5.5% | 14.6% |
Similar Demographics by No Vehicles in Household
Demographics Similar to Colombians by No Vehicles in Household
In terms of no vehicles in household, the demographic groups most similar to Colombians are Immigrants from Eastern Africa (10.0%, a difference of 0.010%), Immigrants from Congo (10.1%, a difference of 0.15%), Tlingit-Haida (10.1%, a difference of 0.24%), Sioux (10.1%, a difference of 0.26%), and Salvadoran (10.1%, a difference of 0.27%).
| Demographics | Rating | Rank | No Vehicles in Household |
| Chileans | 81.2 /100 | #143 | Excellent 9.9% |
| Immigrants | Bahamas | 81.2 /100 | #144 | Excellent 9.9% |
| Bahamians | 81.0 /100 | #145 | Excellent 9.9% |
| Hungarians | 80.0 /100 | #146 | Excellent 9.9% |
| Immigrants | Nicaragua | 79.8 /100 | #147 | Good 9.9% |
| Immigrants | Bosnia and Herzegovina | 79.1 /100 | #148 | Good 9.9% |
| Immigrants | Uganda | 76.1 /100 | #149 | Good 10.0% |
| Colombians | 73.9 /100 | #150 | Good 10.0% |
| Immigrants | Eastern Africa | 73.8 /100 | #151 | Good 10.0% |
| Immigrants | Congo | 73.0 /100 | #152 | Good 10.1% |
| Tlingit-Haida | 72.5 /100 | #153 | Good 10.1% |
| Sioux | 72.4 /100 | #154 | Good 10.1% |
| Salvadorans | 72.4 /100 | #155 | Good 10.1% |
| Immigrants | Micronesia | 70.9 /100 | #156 | Good 10.1% |
| Australians | 70.6 /100 | #157 | Good 10.1% |
Demographics Similar to Immigrants from Eastern Asia by No Vehicles in Household
In terms of no vehicles in household, the demographic groups most similar to Immigrants from Eastern Asia are Immigrants from Kazakhstan (13.6%, a difference of 0.040%), Immigrants from Malaysia (13.6%, a difference of 0.28%), Immigrants from Eastern Europe (13.6%, a difference of 0.33%), Colville (13.7%, a difference of 0.99%), and Immigrants from Ireland (13.7%, a difference of 1.2%).
| Demographics | Rating | Rank | No Vehicles in Household |
| Immigrants | Albania | 0.1 /100 | #275 | Tragic 13.0% |
| Immigrants | Southern Europe | 0.1 /100 | #276 | Tragic 13.0% |
| Aleuts | 0.1 /100 | #277 | Tragic 13.0% |
| Immigrants | Croatia | 0.1 /100 | #278 | Tragic 13.0% |
| Mongolians | 0.0 /100 | #279 | Tragic 13.1% |
| Alsatians | 0.0 /100 | #280 | Tragic 13.2% |
| Central American Indians | 0.0 /100 | #281 | Tragic 13.3% |
| Immigrants | Eastern Asia | 0.0 /100 | #282 | Tragic 13.5% |
| Immigrants | Kazakhstan | 0.0 /100 | #283 | Tragic 13.6% |
| Immigrants | Malaysia | 0.0 /100 | #284 | Tragic 13.6% |
| Immigrants | Eastern Europe | 0.0 /100 | #285 | Tragic 13.6% |
| Colville | 0.0 /100 | #286 | Tragic 13.7% |
| Immigrants | Ireland | 0.0 /100 | #287 | Tragic 13.7% |
| Hopi | 0.0 /100 | #288 | Tragic 13.7% |
| Immigrants | Australia | 0.0 /100 | #289 | Tragic 13.8% |