Colombian vs Immigrants from Colombia 7th Grade
COMPARE
Colombian
Immigrants from Colombia
7th Grade
7th Grade Comparison
Colombians
Immigrants from Colombia
95.3%
7TH GRADE
0.8/ 100
METRIC RATING
254th/ 347
METRIC RANK
95.1%
7TH GRADE
0.2/ 100
METRIC RATING
275th/ 347
METRIC RANK
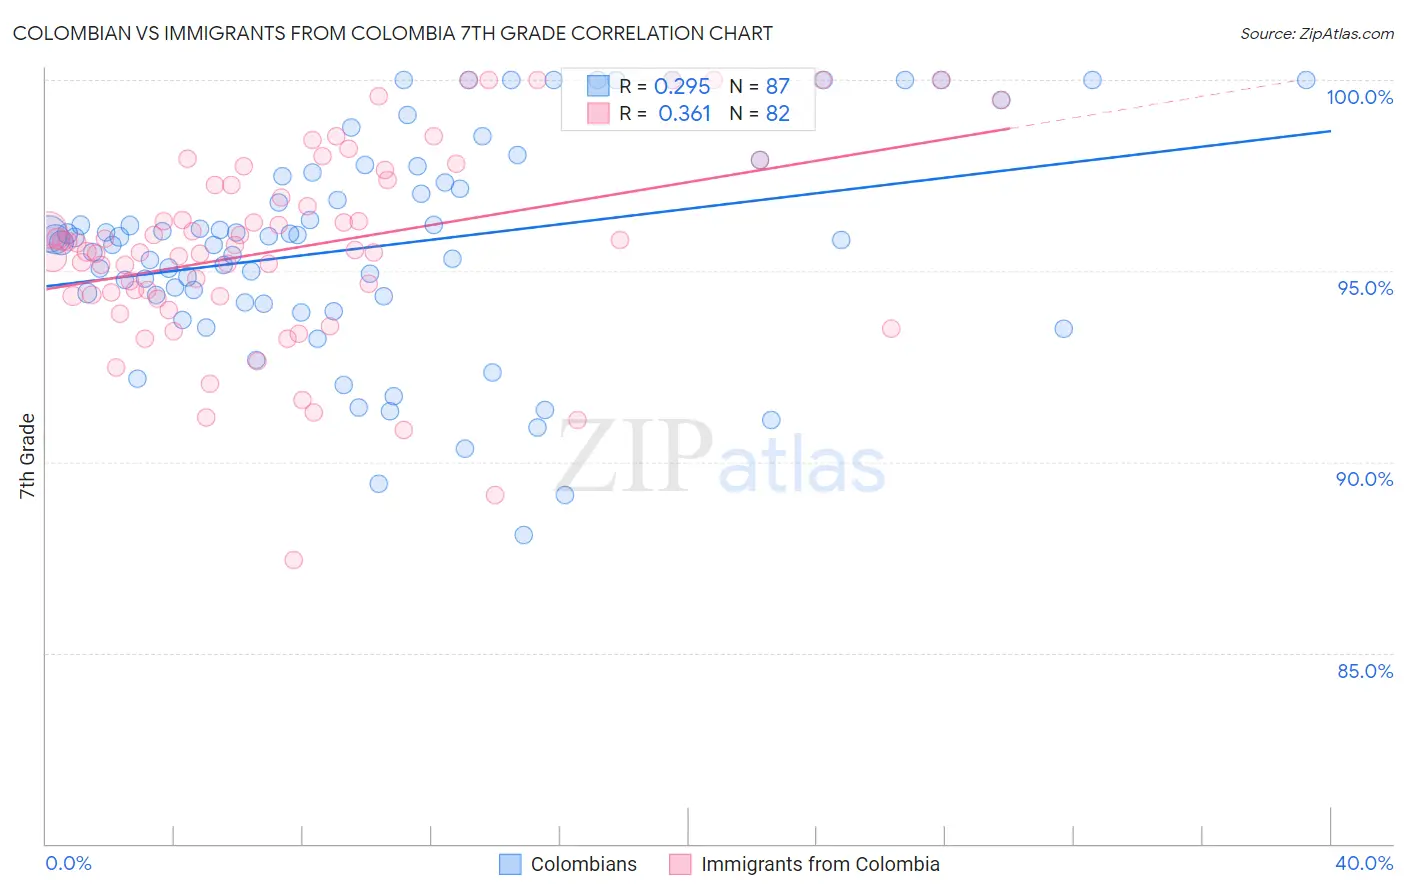
Colombian vs Immigrants from Colombia 7th Grade Correlation Chart
The statistical analysis conducted on geographies consisting of 419,655,116 people shows a weak positive correlation between the proportion of Colombians and percentage of population with at least 7th grade education in the United States with a correlation coefficient (R) of 0.295 and weighted average of 95.3%. Similarly, the statistical analysis conducted on geographies consisting of 378,598,469 people shows a mild positive correlation between the proportion of Immigrants from Colombia and percentage of population with at least 7th grade education in the United States with a correlation coefficient (R) of 0.361 and weighted average of 95.1%, a difference of 0.22%.
7th Grade Correlation Summary
| Measurement | Colombian | Immigrants from Colombia |
| Minimum | 88.1% | 87.4% |
| Maximum | 100.0% | 100.0% |
| Range | 11.9% | 12.6% |
| Mean | 95.6% | 95.6% |
| Median | 95.8% | 95.6% |
| Interquartile 25% (IQ1) | 94.2% | 94.3% |
| Interquartile 75% (IQ3) | 97.5% | 97.3% |
| Interquartile Range (IQR) | 3.3% | 2.9% |
| Standard Deviation (Sample) | 2.8% | 2.6% |
| Standard Deviation (Population) | 2.8% | 2.5% |
Similar Demographics by 7th Grade
Demographics Similar to Colombians by 7th Grade
In terms of 7th grade, the demographic groups most similar to Colombians are Somali (95.3%, a difference of 0.010%), Korean (95.3%, a difference of 0.010%), Immigrants from Cameroon (95.4%, a difference of 0.020%), Immigrants from Jamaica (95.4%, a difference of 0.020%), and Immigrants from Ethiopia (95.3%, a difference of 0.020%).
| Demographics | Rating | Rank | 7th Grade |
| Tongans | 1.3 /100 | #247 | Tragic 95.4% |
| Paiute | 1.2 /100 | #248 | Tragic 95.4% |
| Bolivians | 1.1 /100 | #249 | Tragic 95.4% |
| Immigrants | Cameroon | 0.9 /100 | #250 | Tragic 95.4% |
| Immigrants | Jamaica | 0.9 /100 | #251 | Tragic 95.4% |
| Immigrants | Ethiopia | 0.9 /100 | #252 | Tragic 95.3% |
| Somalis | 0.9 /100 | #253 | Tragic 95.3% |
| Colombians | 0.8 /100 | #254 | Tragic 95.3% |
| Koreans | 0.8 /100 | #255 | Tragic 95.3% |
| Immigrants | China | 0.7 /100 | #256 | Tragic 95.3% |
| Immigrants | Congo | 0.7 /100 | #257 | Tragic 95.3% |
| Ghanaians | 0.7 /100 | #258 | Tragic 95.3% |
| Immigrants | Costa Rica | 0.6 /100 | #259 | Tragic 95.3% |
| Afghans | 0.5 /100 | #260 | Tragic 95.3% |
| South Americans | 0.5 /100 | #261 | Tragic 95.2% |
Demographics Similar to Immigrants from Colombia by 7th Grade
In terms of 7th grade, the demographic groups most similar to Immigrants from Colombia are Peruvian (95.1%, a difference of 0.010%), Immigrants from Uzbekistan (95.1%, a difference of 0.010%), Immigrants from Western Africa (95.1%, a difference of 0.010%), Houma (95.1%, a difference of 0.020%), and Immigrants from South America (95.1%, a difference of 0.020%).
| Demographics | Rating | Rank | 7th Grade |
| Immigrants | Hong Kong | 0.3 /100 | #268 | Tragic 95.2% |
| Trinidadians and Tobagonians | 0.3 /100 | #269 | Tragic 95.2% |
| Houma | 0.2 /100 | #270 | Tragic 95.1% |
| Immigrants | South America | 0.2 /100 | #271 | Tragic 95.1% |
| Peruvians | 0.2 /100 | #272 | Tragic 95.1% |
| Immigrants | Uzbekistan | 0.2 /100 | #273 | Tragic 95.1% |
| Immigrants | Western Africa | 0.2 /100 | #274 | Tragic 95.1% |
| Immigrants | Colombia | 0.2 /100 | #275 | Tragic 95.1% |
| Immigrants | Thailand | 0.2 /100 | #276 | Tragic 95.1% |
| Immigrants | Afghanistan | 0.2 /100 | #277 | Tragic 95.1% |
| Immigrants | Trinidad and Tobago | 0.1 /100 | #278 | Tragic 95.1% |
| Barbadians | 0.1 /100 | #279 | Tragic 95.1% |
| Immigrants | St. Vincent and the Grenadines | 0.1 /100 | #280 | Tragic 95.0% |
| Tohono O'odham | 0.1 /100 | #281 | Tragic 95.0% |
| Immigrants | Bolivia | 0.1 /100 | #282 | Tragic 95.0% |